Lithuanian vs Immigrants from Laos Single Mother Poverty
COMPARE
Lithuanian
Immigrants from Laos
Single Mother Poverty
Single Mother Poverty Comparison
Lithuanians
Immigrants from Laos
27.4%
SINGLE MOTHER POVERTY
99.4/ 100
METRIC RATING
69th/ 347
METRIC RANK
30.6%
SINGLE MOTHER POVERTY
1.8/ 100
METRIC RATING
241st/ 347
METRIC RANK
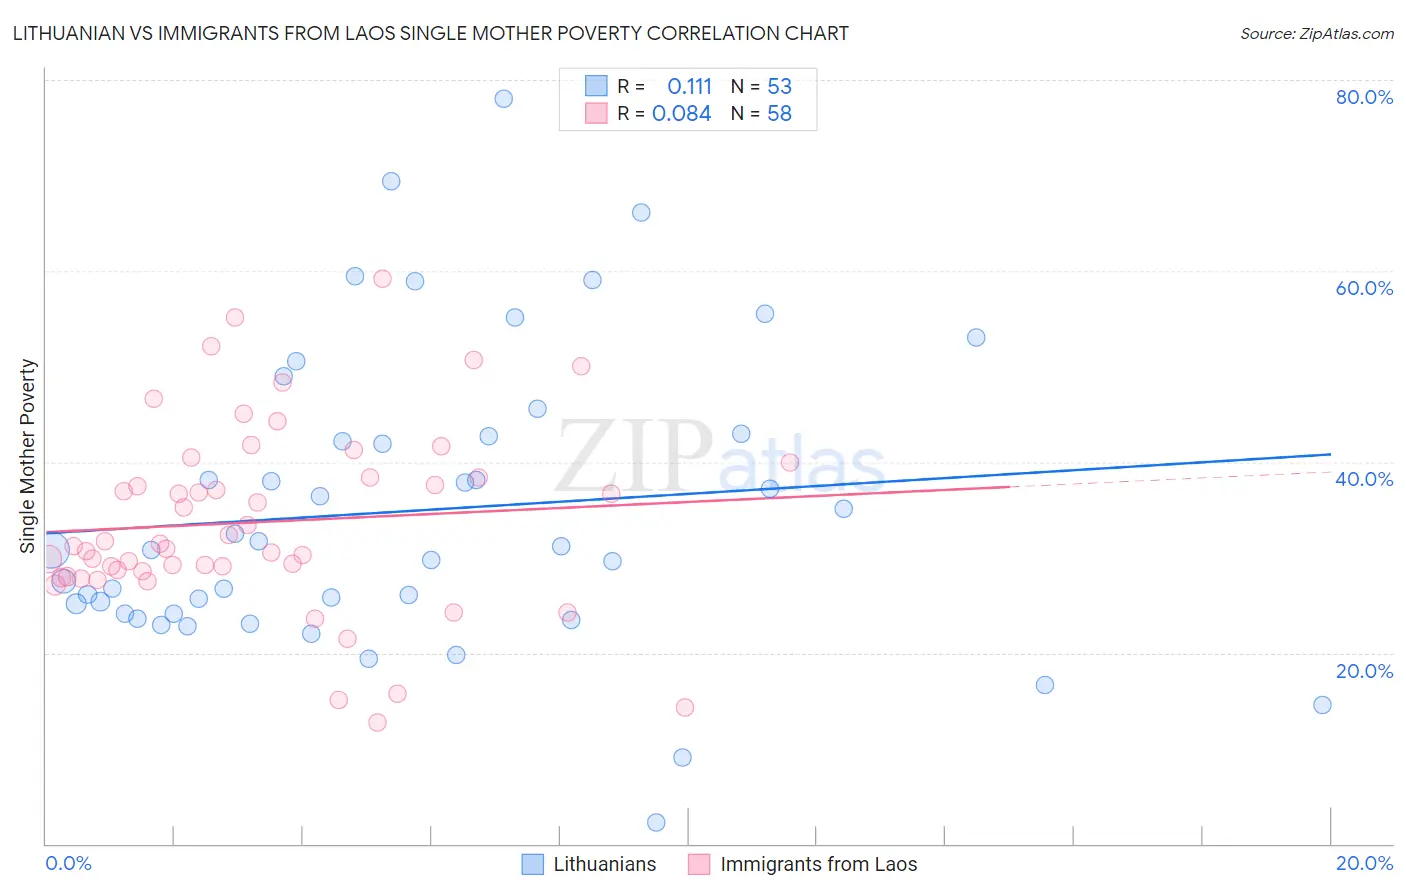
Lithuanian vs Immigrants from Laos Single Mother Poverty Correlation Chart
The statistical analysis conducted on geographies consisting of 407,174,767 people shows a poor positive correlation between the proportion of Lithuanians and poverty level among single mothers in the United States with a correlation coefficient (R) of 0.111 and weighted average of 27.4%. Similarly, the statistical analysis conducted on geographies consisting of 199,327,498 people shows a slight positive correlation between the proportion of Immigrants from Laos and poverty level among single mothers in the United States with a correlation coefficient (R) of 0.084 and weighted average of 30.6%, a difference of 11.6%.
Single Mother Poverty Correlation Summary
| Measurement | Lithuanian | Immigrants from Laos |
| Minimum | 2.2% | 12.7% |
| Maximum | 78.1% | 59.2% |
| Range | 75.9% | 46.5% |
| Mean | 34.9% | 33.7% |
| Median | 30.8% | 31.3% |
| Interquartile 25% (IQ1) | 24.1% | 28.5% |
| Interquartile 75% (IQ3) | 42.8% | 38.3% |
| Interquartile Range (IQR) | 18.7% | 9.9% |
| Standard Deviation (Sample) | 15.6% | 9.8% |
| Standard Deviation (Population) | 15.5% | 9.7% |
Similar Demographics by Single Mother Poverty
Demographics Similar to Lithuanians by Single Mother Poverty
In terms of single mother poverty, the demographic groups most similar to Lithuanians are Immigrants from Belarus (27.4%, a difference of 0.010%), Macedonian (27.4%, a difference of 0.030%), Immigrants from Russia (27.4%, a difference of 0.060%), Sierra Leonean (27.4%, a difference of 0.12%), and Immigrants from Czechoslovakia (27.4%, a difference of 0.16%).
| Demographics | Rating | Rank | Single Mother Poverty |
| Immigrants | Malaysia | 99.5 /100 | #62 | Exceptional 27.3% |
| Immigrants | Northern Europe | 99.5 /100 | #63 | Exceptional 27.3% |
| Russians | 99.5 /100 | #64 | Exceptional 27.3% |
| Immigrants | Turkey | 99.5 /100 | #65 | Exceptional 27.3% |
| Soviet Union | 99.5 /100 | #66 | Exceptional 27.3% |
| Immigrants | Australia | 99.5 /100 | #67 | Exceptional 27.3% |
| Immigrants | Czechoslovakia | 99.5 /100 | #68 | Exceptional 27.4% |
| Lithuanians | 99.4 /100 | #69 | Exceptional 27.4% |
| Immigrants | Belarus | 99.4 /100 | #70 | Exceptional 27.4% |
| Macedonians | 99.4 /100 | #71 | Exceptional 27.4% |
| Immigrants | Russia | 99.4 /100 | #72 | Exceptional 27.4% |
| Sierra Leoneans | 99.3 /100 | #73 | Exceptional 27.4% |
| Immigrants | Europe | 99.3 /100 | #74 | Exceptional 27.4% |
| Immigrants | Sweden | 99.2 /100 | #75 | Exceptional 27.5% |
| Peruvians | 99.2 /100 | #76 | Exceptional 27.5% |
Demographics Similar to Immigrants from Laos by Single Mother Poverty
In terms of single mother poverty, the demographic groups most similar to Immigrants from Laos are Immigrants from Burma/Myanmar (30.6%, a difference of 0.020%), Salvadoran (30.6%, a difference of 0.050%), Bermudan (30.6%, a difference of 0.10%), Immigrants from Portugal (30.5%, a difference of 0.18%), and French (30.7%, a difference of 0.32%).
| Demographics | Rating | Rank | Single Mother Poverty |
| Immigrants | Nicaragua | 3.5 /100 | #234 | Tragic 30.3% |
| Immigrants | Grenada | 3.4 /100 | #235 | Tragic 30.3% |
| Welsh | 3.2 /100 | #236 | Tragic 30.4% |
| Immigrants | St. Vincent and the Grenadines | 3.1 /100 | #237 | Tragic 30.4% |
| Slovaks | 2.8 /100 | #238 | Tragic 30.4% |
| Immigrants | Portugal | 2.1 /100 | #239 | Tragic 30.5% |
| Salvadorans | 1.8 /100 | #240 | Tragic 30.6% |
| Immigrants | Laos | 1.8 /100 | #241 | Tragic 30.6% |
| Immigrants | Burma/Myanmar | 1.7 /100 | #242 | Tragic 30.6% |
| Bermudans | 1.6 /100 | #243 | Tragic 30.6% |
| French | 1.3 /100 | #244 | Tragic 30.7% |
| Barbadians | 1.3 /100 | #245 | Tragic 30.7% |
| Ecuadorians | 0.9 /100 | #246 | Tragic 30.8% |
| West Indians | 0.9 /100 | #247 | Tragic 30.8% |
| French Canadians | 0.9 /100 | #248 | Tragic 30.8% |