Ecuadorian vs Immigrants from Laos Single Mother Poverty
COMPARE
Ecuadorian
Immigrants from Laos
Single Mother Poverty
Single Mother Poverty Comparison
Ecuadorians
Immigrants from Laos
30.8%
SINGLE MOTHER POVERTY
0.9/ 100
METRIC RATING
246th/ 347
METRIC RANK
30.6%
SINGLE MOTHER POVERTY
1.8/ 100
METRIC RATING
241st/ 347
METRIC RANK
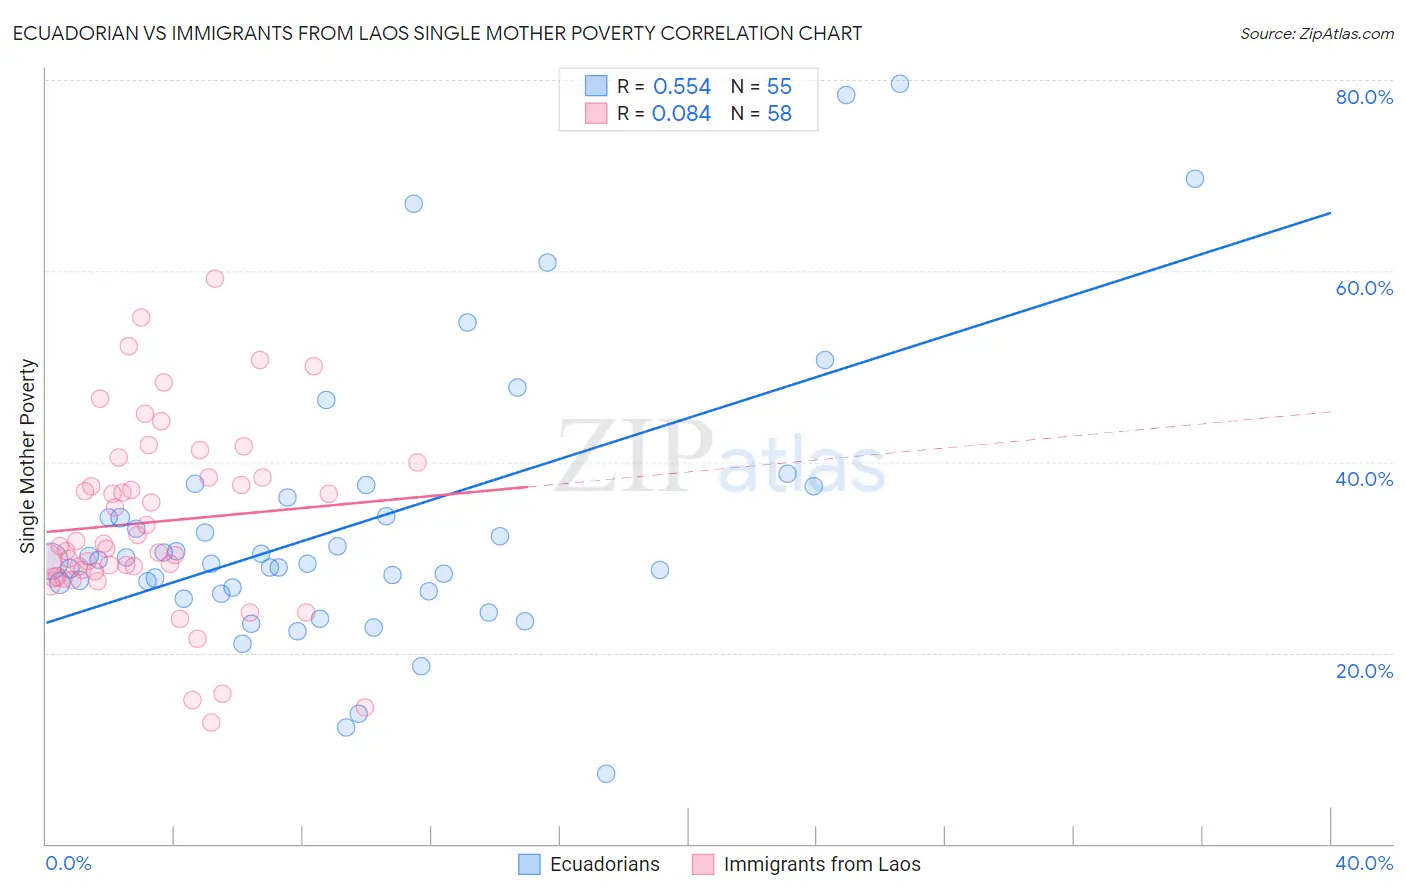
Ecuadorian vs Immigrants from Laos Single Mother Poverty Correlation Chart
The statistical analysis conducted on geographies consisting of 311,375,048 people shows a substantial positive correlation between the proportion of Ecuadorians and poverty level among single mothers in the United States with a correlation coefficient (R) of 0.554 and weighted average of 30.8%. Similarly, the statistical analysis conducted on geographies consisting of 199,327,498 people shows a slight positive correlation between the proportion of Immigrants from Laos and poverty level among single mothers in the United States with a correlation coefficient (R) of 0.084 and weighted average of 30.6%, a difference of 0.73%.
Single Mother Poverty Correlation Summary
| Measurement | Ecuadorian | Immigrants from Laos |
| Minimum | 7.3% | 12.7% |
| Maximum | 79.6% | 59.2% |
| Range | 72.3% | 46.5% |
| Mean | 33.5% | 33.7% |
| Median | 29.6% | 31.3% |
| Interquartile 25% (IQ1) | 26.5% | 28.5% |
| Interquartile 75% (IQ3) | 36.2% | 38.3% |
| Interquartile Range (IQR) | 9.8% | 9.9% |
| Standard Deviation (Sample) | 14.7% | 9.8% |
| Standard Deviation (Population) | 14.6% | 9.7% |
Demographics Similar to Ecuadorians and Immigrants from Laos by Single Mother Poverty
In terms of single mother poverty, the demographic groups most similar to Ecuadorians are West Indian (30.8%, a difference of 0.040%), French Canadian (30.8%, a difference of 0.080%), Cape Verdean (30.8%, a difference of 0.15%), Vietnamese (30.9%, a difference of 0.30%), and Barbadian (30.7%, a difference of 0.40%). Similarly, the demographic groups most similar to Immigrants from Laos are Immigrants from Burma/Myanmar (30.6%, a difference of 0.020%), Salvadoran (30.6%, a difference of 0.050%), Bermudan (30.6%, a difference of 0.10%), Immigrants from Portugal (30.5%, a difference of 0.18%), and French (30.7%, a difference of 0.32%).
| Demographics | Rating | Rank | Single Mother Poverty |
| Immigrants | Middle Africa | 3.5 /100 | #233 | Tragic 30.3% |
| Immigrants | Nicaragua | 3.5 /100 | #234 | Tragic 30.3% |
| Immigrants | Grenada | 3.4 /100 | #235 | Tragic 30.3% |
| Welsh | 3.2 /100 | #236 | Tragic 30.4% |
| Immigrants | St. Vincent and the Grenadines | 3.1 /100 | #237 | Tragic 30.4% |
| Slovaks | 2.8 /100 | #238 | Tragic 30.4% |
| Immigrants | Portugal | 2.1 /100 | #239 | Tragic 30.5% |
| Salvadorans | 1.8 /100 | #240 | Tragic 30.6% |
| Immigrants | Laos | 1.8 /100 | #241 | Tragic 30.6% |
| Immigrants | Burma/Myanmar | 1.7 /100 | #242 | Tragic 30.6% |
| Bermudans | 1.6 /100 | #243 | Tragic 30.6% |
| French | 1.3 /100 | #244 | Tragic 30.7% |
| Barbadians | 1.3 /100 | #245 | Tragic 30.7% |
| Ecuadorians | 0.9 /100 | #246 | Tragic 30.8% |
| West Indians | 0.9 /100 | #247 | Tragic 30.8% |
| French Canadians | 0.9 /100 | #248 | Tragic 30.8% |
| Cape Verdeans | 0.8 /100 | #249 | Tragic 30.8% |
| Vietnamese | 0.7 /100 | #250 | Tragic 30.9% |
| Tlingit-Haida | 0.6 /100 | #251 | Tragic 30.9% |
| Alaska Natives | 0.6 /100 | #252 | Tragic 30.9% |
| Celtics | 0.6 /100 | #253 | Tragic 30.9% |