Basque vs Syrian Single Mother Poverty
COMPARE
Basque
Syrian
Single Mother Poverty
Single Mother Poverty Comparison
Basques
Syrians
29.5%
SINGLE MOTHER POVERTY
28.3/ 100
METRIC RATING
193rd/ 347
METRIC RANK
28.6%
SINGLE MOTHER POVERTY
85.3/ 100
METRIC RATING
148th/ 347
METRIC RANK
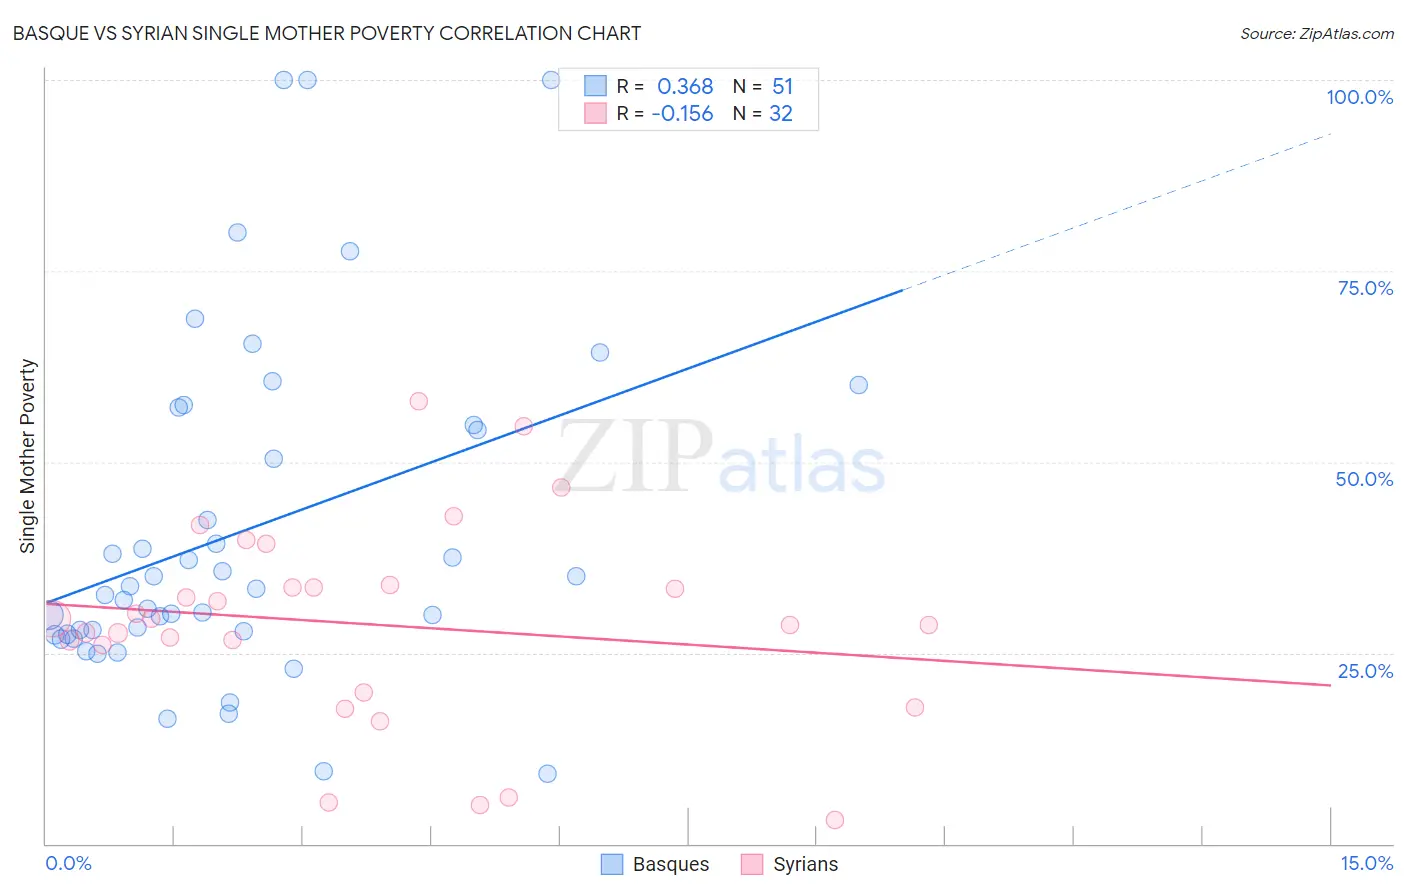
Basque vs Syrian Single Mother Poverty Correlation Chart
The statistical analysis conducted on geographies consisting of 163,930,672 people shows a mild positive correlation between the proportion of Basques and poverty level among single mothers in the United States with a correlation coefficient (R) of 0.368 and weighted average of 29.5%. Similarly, the statistical analysis conducted on geographies consisting of 260,676,896 people shows a poor negative correlation between the proportion of Syrians and poverty level among single mothers in the United States with a correlation coefficient (R) of -0.156 and weighted average of 28.6%, a difference of 3.3%.
Single Mother Poverty Correlation Summary
| Measurement | Basque | Syrian |
| Minimum | 9.1% | 3.1% |
| Maximum | 100.0% | 58.0% |
| Range | 90.9% | 54.9% |
| Mean | 41.0% | 28.8% |
| Median | 33.3% | 29.0% |
| Interquartile 25% (IQ1) | 27.4% | 22.9% |
| Interquartile 75% (IQ3) | 54.8% | 33.7% |
| Interquartile Range (IQR) | 27.3% | 10.8% |
| Standard Deviation (Sample) | 22.0% | 13.2% |
| Standard Deviation (Population) | 21.8% | 12.9% |
Similar Demographics by Single Mother Poverty
Demographics Similar to Basques by Single Mother Poverty
In terms of single mother poverty, the demographic groups most similar to Basques are Moroccan (29.5%, a difference of 0.020%), Immigrants from Trinidad and Tobago (29.5%, a difference of 0.050%), Immigrants from Germany (29.5%, a difference of 0.12%), Icelander (29.5%, a difference of 0.13%), and Immigrants from Africa (29.4%, a difference of 0.19%).
| Demographics | Rating | Rank | Single Mother Poverty |
| Yugoslavians | 36.0 /100 | #186 | Fair 29.4% |
| Lebanese | 32.5 /100 | #187 | Fair 29.4% |
| Guamanians/Chamorros | 31.8 /100 | #188 | Fair 29.4% |
| Immigrants | Africa | 31.6 /100 | #189 | Fair 29.4% |
| Immigrants | Germany | 30.4 /100 | #190 | Fair 29.5% |
| Immigrants | Trinidad and Tobago | 29.2 /100 | #191 | Fair 29.5% |
| Moroccans | 28.6 /100 | #192 | Fair 29.5% |
| Basques | 28.3 /100 | #193 | Fair 29.5% |
| Icelanders | 26.1 /100 | #194 | Fair 29.5% |
| Slavs | 24.5 /100 | #195 | Fair 29.6% |
| Spanish American Indians | 23.4 /100 | #196 | Fair 29.6% |
| Immigrants | Jamaica | 22.0 /100 | #197 | Fair 29.6% |
| Trinidadians and Tobagonians | 21.7 /100 | #198 | Fair 29.6% |
| Cubans | 20.8 /100 | #199 | Fair 29.6% |
| Panamanians | 20.0 /100 | #200 | Fair 29.6% |
Demographics Similar to Syrians by Single Mother Poverty
In terms of single mother poverty, the demographic groups most similar to Syrians are Immigrants from Lebanon (28.6%, a difference of 0.010%), Serbian (28.6%, a difference of 0.020%), Immigrants from South America (28.5%, a difference of 0.080%), Immigrants from Denmark (28.5%, a difference of 0.080%), and Luxembourger (28.5%, a difference of 0.12%).
| Demographics | Rating | Rank | Single Mother Poverty |
| Danes | 87.1 /100 | #141 | Excellent 28.5% |
| South Africans | 86.6 /100 | #142 | Excellent 28.5% |
| Immigrants | North America | 86.5 /100 | #143 | Excellent 28.5% |
| Luxembourgers | 86.4 /100 | #144 | Excellent 28.5% |
| Immigrants | South America | 86.1 /100 | #145 | Excellent 28.5% |
| Immigrants | Denmark | 86.1 /100 | #146 | Excellent 28.5% |
| Immigrants | Lebanon | 85.3 /100 | #147 | Excellent 28.6% |
| Syrians | 85.3 /100 | #148 | Excellent 28.6% |
| Serbians | 85.0 /100 | #149 | Excellent 28.6% |
| Northern Europeans | 81.7 /100 | #150 | Excellent 28.6% |
| Immigrants | Oceania | 79.9 /100 | #151 | Good 28.7% |
| Austrians | 79.0 /100 | #152 | Good 28.7% |
| Slovenes | 76.4 /100 | #153 | Good 28.8% |
| Portuguese | 73.2 /100 | #154 | Good 28.8% |
| Ugandans | 71.7 /100 | #155 | Good 28.8% |