Basque vs Ecuadorian Single Mother Poverty
COMPARE
Basque
Ecuadorian
Single Mother Poverty
Single Mother Poverty Comparison
Basques
Ecuadorians
29.5%
SINGLE MOTHER POVERTY
28.3/ 100
METRIC RATING
193rd/ 347
METRIC RANK
30.8%
SINGLE MOTHER POVERTY
0.9/ 100
METRIC RATING
246th/ 347
METRIC RANK
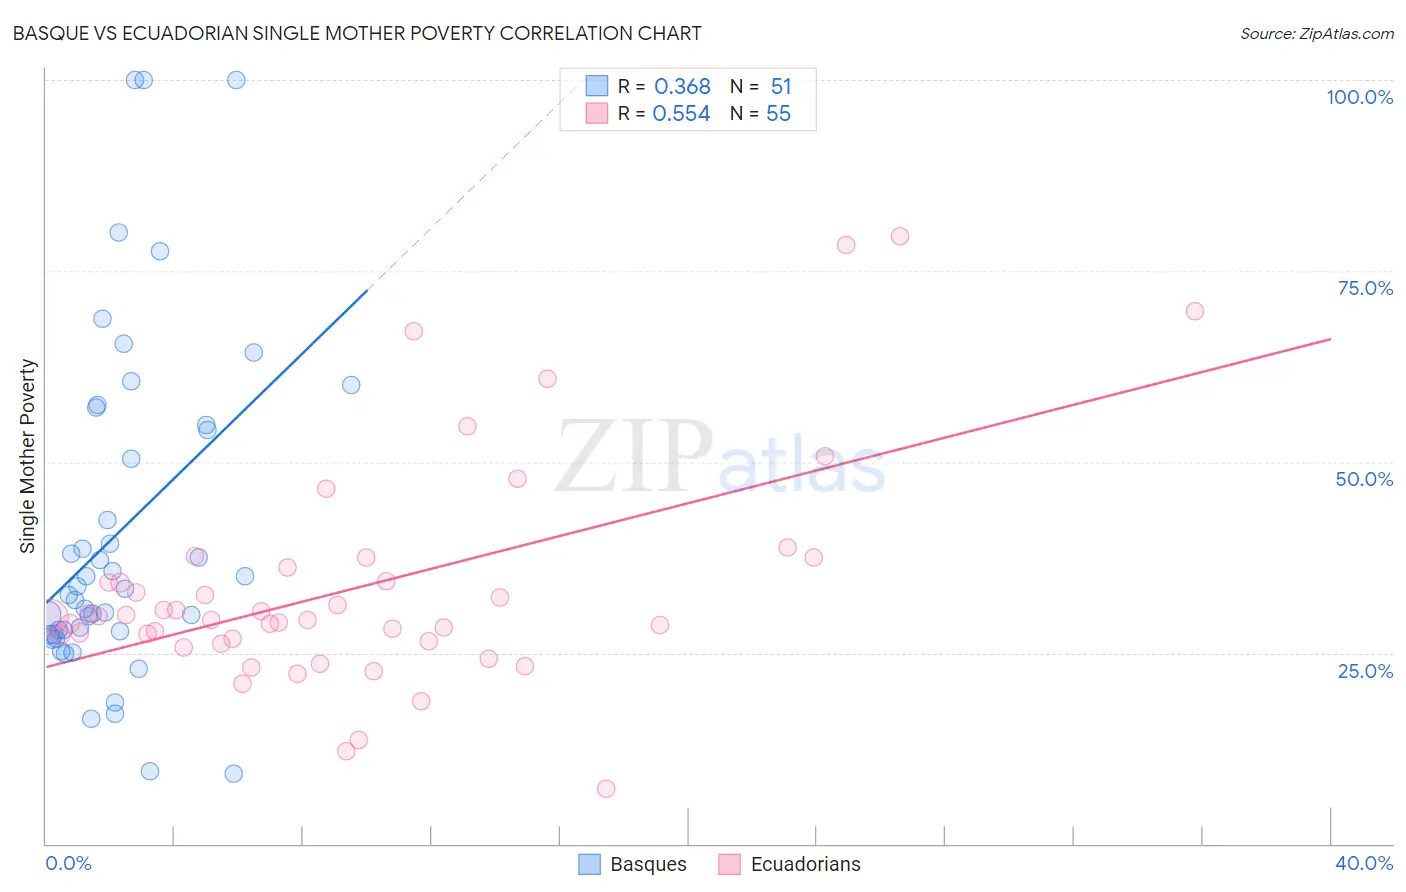
Basque vs Ecuadorian Single Mother Poverty Correlation Chart
The statistical analysis conducted on geographies consisting of 163,930,672 people shows a mild positive correlation between the proportion of Basques and poverty level among single mothers in the United States with a correlation coefficient (R) of 0.368 and weighted average of 29.5%. Similarly, the statistical analysis conducted on geographies consisting of 311,375,048 people shows a substantial positive correlation between the proportion of Ecuadorians and poverty level among single mothers in the United States with a correlation coefficient (R) of 0.554 and weighted average of 30.8%, a difference of 4.4%.
Single Mother Poverty Correlation Summary
| Measurement | Basque | Ecuadorian |
| Minimum | 9.1% | 7.3% |
| Maximum | 100.0% | 79.6% |
| Range | 90.9% | 72.3% |
| Mean | 41.0% | 33.5% |
| Median | 33.3% | 29.6% |
| Interquartile 25% (IQ1) | 27.4% | 26.5% |
| Interquartile 75% (IQ3) | 54.8% | 36.2% |
| Interquartile Range (IQR) | 27.3% | 9.8% |
| Standard Deviation (Sample) | 22.0% | 14.7% |
| Standard Deviation (Population) | 21.8% | 14.6% |
Similar Demographics by Single Mother Poverty
Demographics Similar to Basques by Single Mother Poverty
In terms of single mother poverty, the demographic groups most similar to Basques are Moroccan (29.5%, a difference of 0.020%), Immigrants from Trinidad and Tobago (29.5%, a difference of 0.050%), Immigrants from Germany (29.5%, a difference of 0.12%), Icelander (29.5%, a difference of 0.13%), and Immigrants from Africa (29.4%, a difference of 0.19%).
| Demographics | Rating | Rank | Single Mother Poverty |
| Yugoslavians | 36.0 /100 | #186 | Fair 29.4% |
| Lebanese | 32.5 /100 | #187 | Fair 29.4% |
| Guamanians/Chamorros | 31.8 /100 | #188 | Fair 29.4% |
| Immigrants | Africa | 31.6 /100 | #189 | Fair 29.4% |
| Immigrants | Germany | 30.4 /100 | #190 | Fair 29.5% |
| Immigrants | Trinidad and Tobago | 29.2 /100 | #191 | Fair 29.5% |
| Moroccans | 28.6 /100 | #192 | Fair 29.5% |
| Basques | 28.3 /100 | #193 | Fair 29.5% |
| Icelanders | 26.1 /100 | #194 | Fair 29.5% |
| Slavs | 24.5 /100 | #195 | Fair 29.6% |
| Spanish American Indians | 23.4 /100 | #196 | Fair 29.6% |
| Immigrants | Jamaica | 22.0 /100 | #197 | Fair 29.6% |
| Trinidadians and Tobagonians | 21.7 /100 | #198 | Fair 29.6% |
| Cubans | 20.8 /100 | #199 | Fair 29.6% |
| Panamanians | 20.0 /100 | #200 | Fair 29.6% |
Demographics Similar to Ecuadorians by Single Mother Poverty
In terms of single mother poverty, the demographic groups most similar to Ecuadorians are West Indian (30.8%, a difference of 0.040%), French Canadian (30.8%, a difference of 0.080%), Cape Verdean (30.8%, a difference of 0.15%), Vietnamese (30.9%, a difference of 0.30%), and Barbadian (30.7%, a difference of 0.40%).
| Demographics | Rating | Rank | Single Mother Poverty |
| Immigrants | Portugal | 2.1 /100 | #239 | Tragic 30.5% |
| Salvadorans | 1.8 /100 | #240 | Tragic 30.6% |
| Immigrants | Laos | 1.8 /100 | #241 | Tragic 30.6% |
| Immigrants | Burma/Myanmar | 1.7 /100 | #242 | Tragic 30.6% |
| Bermudans | 1.6 /100 | #243 | Tragic 30.6% |
| French | 1.3 /100 | #244 | Tragic 30.7% |
| Barbadians | 1.3 /100 | #245 | Tragic 30.7% |
| Ecuadorians | 0.9 /100 | #246 | Tragic 30.8% |
| West Indians | 0.9 /100 | #247 | Tragic 30.8% |
| French Canadians | 0.9 /100 | #248 | Tragic 30.8% |
| Cape Verdeans | 0.8 /100 | #249 | Tragic 30.8% |
| Vietnamese | 0.7 /100 | #250 | Tragic 30.9% |
| Tlingit-Haida | 0.6 /100 | #251 | Tragic 30.9% |
| Alaska Natives | 0.6 /100 | #252 | Tragic 30.9% |
| Celtics | 0.6 /100 | #253 | Tragic 30.9% |