Basque vs Danish Single Mother Poverty
COMPARE
Basque
Danish
Single Mother Poverty
Single Mother Poverty Comparison
Basques
Danes
29.5%
SINGLE MOTHER POVERTY
28.3/ 100
METRIC RATING
193rd/ 347
METRIC RANK
28.5%
SINGLE MOTHER POVERTY
87.1/ 100
METRIC RATING
141st/ 347
METRIC RANK
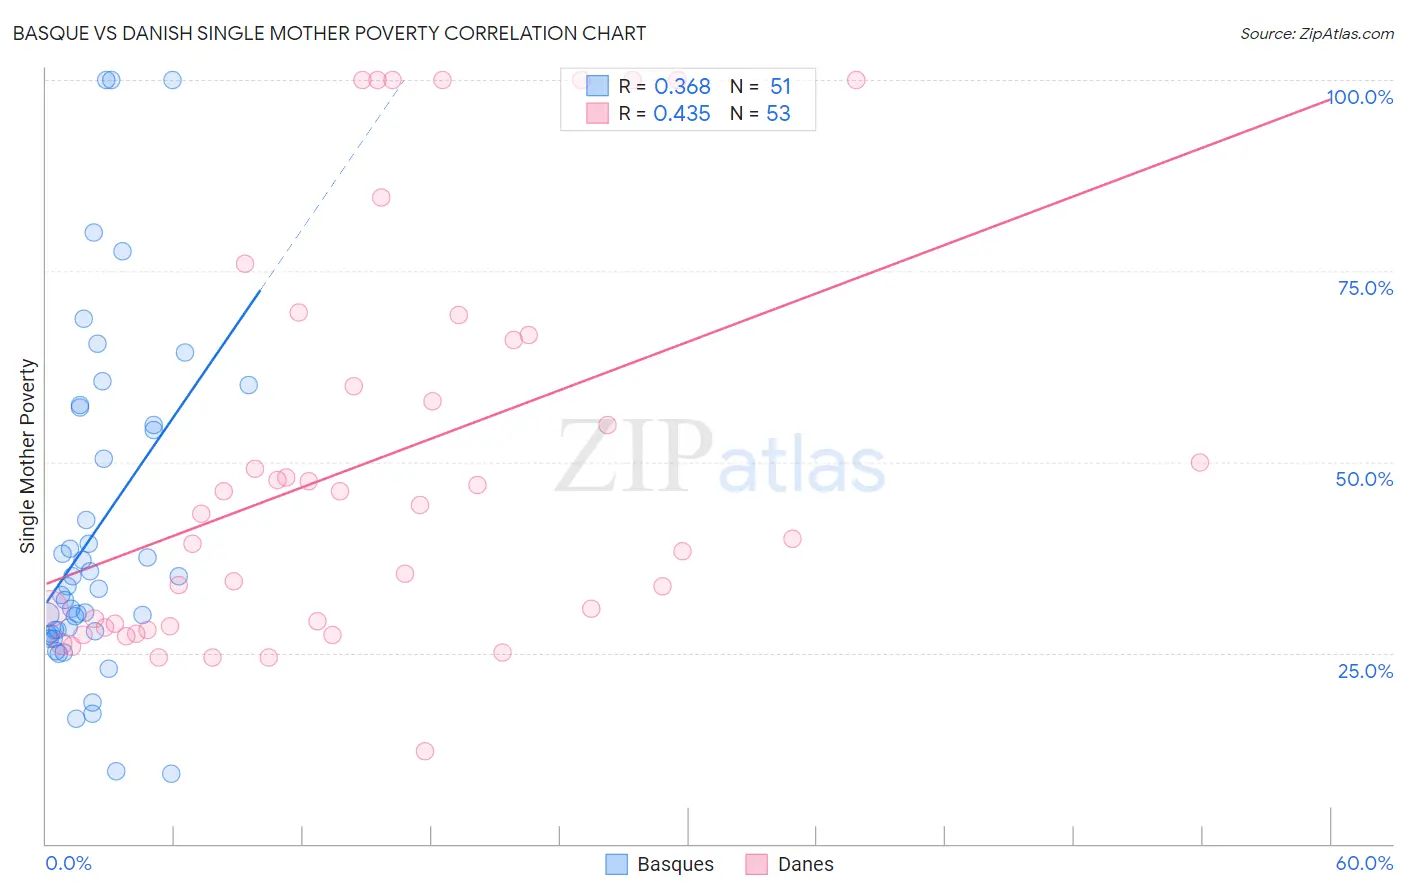
Basque vs Danish Single Mother Poverty Correlation Chart
The statistical analysis conducted on geographies consisting of 163,930,672 people shows a mild positive correlation between the proportion of Basques and poverty level among single mothers in the United States with a correlation coefficient (R) of 0.368 and weighted average of 29.5%. Similarly, the statistical analysis conducted on geographies consisting of 456,210,037 people shows a moderate positive correlation between the proportion of Danes and poverty level among single mothers in the United States with a correlation coefficient (R) of 0.435 and weighted average of 28.5%, a difference of 3.5%.
Single Mother Poverty Correlation Summary
| Measurement | Basque | Danish |
| Minimum | 9.1% | 12.1% |
| Maximum | 100.0% | 100.0% |
| Range | 90.9% | 87.9% |
| Mean | 41.0% | 49.7% |
| Median | 33.3% | 43.2% |
| Interquartile 25% (IQ1) | 27.4% | 28.4% |
| Interquartile 75% (IQ3) | 54.8% | 66.3% |
| Interquartile Range (IQR) | 27.3% | 37.9% |
| Standard Deviation (Sample) | 22.0% | 26.1% |
| Standard Deviation (Population) | 21.8% | 25.9% |
Similar Demographics by Single Mother Poverty
Demographics Similar to Basques by Single Mother Poverty
In terms of single mother poverty, the demographic groups most similar to Basques are Moroccan (29.5%, a difference of 0.020%), Immigrants from Trinidad and Tobago (29.5%, a difference of 0.050%), Immigrants from Germany (29.5%, a difference of 0.12%), Icelander (29.5%, a difference of 0.13%), and Immigrants from Africa (29.4%, a difference of 0.19%).
| Demographics | Rating | Rank | Single Mother Poverty |
| Yugoslavians | 36.0 /100 | #186 | Fair 29.4% |
| Lebanese | 32.5 /100 | #187 | Fair 29.4% |
| Guamanians/Chamorros | 31.8 /100 | #188 | Fair 29.4% |
| Immigrants | Africa | 31.6 /100 | #189 | Fair 29.4% |
| Immigrants | Germany | 30.4 /100 | #190 | Fair 29.5% |
| Immigrants | Trinidad and Tobago | 29.2 /100 | #191 | Fair 29.5% |
| Moroccans | 28.6 /100 | #192 | Fair 29.5% |
| Basques | 28.3 /100 | #193 | Fair 29.5% |
| Icelanders | 26.1 /100 | #194 | Fair 29.5% |
| Slavs | 24.5 /100 | #195 | Fair 29.6% |
| Spanish American Indians | 23.4 /100 | #196 | Fair 29.6% |
| Immigrants | Jamaica | 22.0 /100 | #197 | Fair 29.6% |
| Trinidadians and Tobagonians | 21.7 /100 | #198 | Fair 29.6% |
| Cubans | 20.8 /100 | #199 | Fair 29.6% |
| Panamanians | 20.0 /100 | #200 | Fair 29.6% |
Demographics Similar to Danes by Single Mother Poverty
In terms of single mother poverty, the demographic groups most similar to Danes are South African (28.5%, a difference of 0.050%), Immigrants from North America (28.5%, a difference of 0.060%), Luxembourger (28.5%, a difference of 0.070%), Immigrants from Colombia (28.5%, a difference of 0.10%), and Samoan (28.5%, a difference of 0.11%).
| Demographics | Rating | Rank | Single Mother Poverty |
| Immigrants | Southern Europe | 89.2 /100 | #134 | Excellent 28.4% |
| Immigrants | Spain | 89.2 /100 | #135 | Excellent 28.4% |
| Native Hawaiians | 88.9 /100 | #136 | Excellent 28.4% |
| Immigrants | Canada | 88.9 /100 | #137 | Excellent 28.4% |
| Immigrants | Belgium | 88.5 /100 | #138 | Excellent 28.5% |
| Samoans | 88.1 /100 | #139 | Excellent 28.5% |
| Immigrants | Colombia | 88.0 /100 | #140 | Excellent 28.5% |
| Danes | 87.1 /100 | #141 | Excellent 28.5% |
| South Africans | 86.6 /100 | #142 | Excellent 28.5% |
| Immigrants | North America | 86.5 /100 | #143 | Excellent 28.5% |
| Luxembourgers | 86.4 /100 | #144 | Excellent 28.5% |
| Immigrants | South America | 86.1 /100 | #145 | Excellent 28.5% |
| Immigrants | Denmark | 86.1 /100 | #146 | Excellent 28.5% |
| Immigrants | Lebanon | 85.3 /100 | #147 | Excellent 28.6% |
| Syrians | 85.3 /100 | #148 | Excellent 28.6% |