Basque vs Irish Single Mother Poverty
COMPARE
Basque
Irish
Single Mother Poverty
Single Mother Poverty Comparison
Basques
Irish
29.5%
SINGLE MOTHER POVERTY
28.3/ 100
METRIC RATING
193rd/ 347
METRIC RANK
29.8%
SINGLE MOTHER POVERTY
13.9/ 100
METRIC RATING
209th/ 347
METRIC RANK
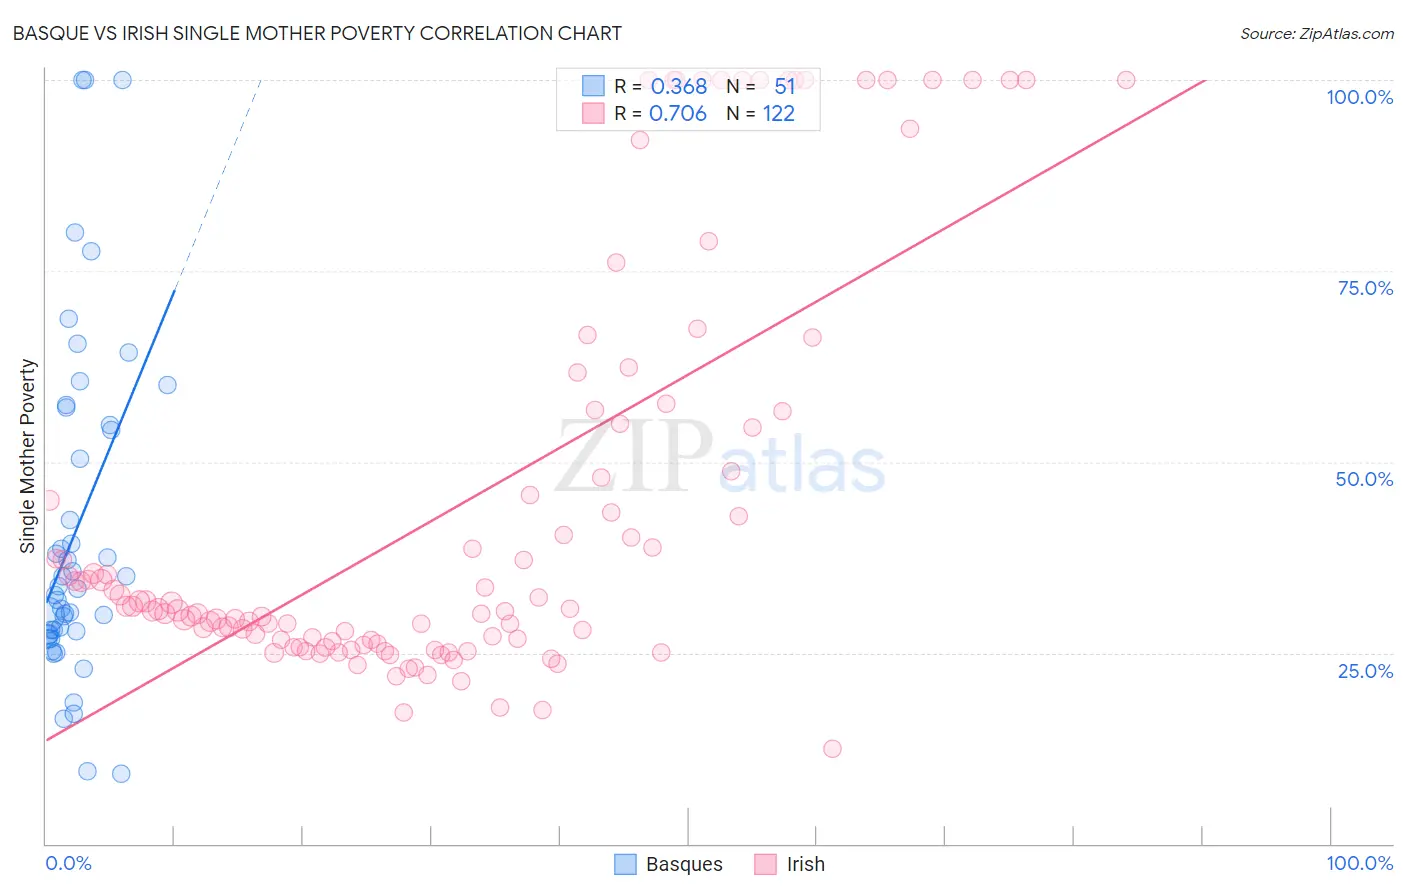
Basque vs Irish Single Mother Poverty Correlation Chart
The statistical analysis conducted on geographies consisting of 163,930,672 people shows a mild positive correlation between the proportion of Basques and poverty level among single mothers in the United States with a correlation coefficient (R) of 0.368 and weighted average of 29.5%. Similarly, the statistical analysis conducted on geographies consisting of 549,467,184 people shows a strong positive correlation between the proportion of Irish and poverty level among single mothers in the United States with a correlation coefficient (R) of 0.706 and weighted average of 29.8%, a difference of 1.1%.
Single Mother Poverty Correlation Summary
| Measurement | Basque | Irish |
| Minimum | 9.1% | 12.4% |
| Maximum | 100.0% | 100.0% |
| Range | 90.9% | 87.6% |
| Mean | 41.0% | 43.8% |
| Median | 33.3% | 30.8% |
| Interquartile 25% (IQ1) | 27.4% | 26.6% |
| Interquartile 75% (IQ3) | 54.8% | 54.5% |
| Interquartile Range (IQR) | 27.3% | 28.0% |
| Standard Deviation (Sample) | 22.0% | 26.6% |
| Standard Deviation (Population) | 21.8% | 26.5% |
Demographics Similar to Basques and Irish by Single Mother Poverty
In terms of single mother poverty, the demographic groups most similar to Basques are Moroccan (29.5%, a difference of 0.020%), Immigrants from Trinidad and Tobago (29.5%, a difference of 0.050%), Icelander (29.5%, a difference of 0.13%), Slavic (29.6%, a difference of 0.23%), and Spanish American Indian (29.6%, a difference of 0.30%). Similarly, the demographic groups most similar to Irish are Haitian (29.8%, a difference of 0.060%), Immigrants from Guyana (29.8%, a difference of 0.080%), Guyanese (29.8%, a difference of 0.11%), Immigrants from Panama (29.8%, a difference of 0.15%), and Immigrants from Haiti (29.7%, a difference of 0.18%).
| Demographics | Rating | Rank | Single Mother Poverty |
| Immigrants | Trinidad and Tobago | 29.2 /100 | #191 | Fair 29.5% |
| Moroccans | 28.6 /100 | #192 | Fair 29.5% |
| Basques | 28.3 /100 | #193 | Fair 29.5% |
| Icelanders | 26.1 /100 | #194 | Fair 29.5% |
| Slavs | 24.5 /100 | #195 | Fair 29.6% |
| Spanish American Indians | 23.4 /100 | #196 | Fair 29.6% |
| Immigrants | Jamaica | 22.0 /100 | #197 | Fair 29.6% |
| Trinidadians and Tobagonians | 21.7 /100 | #198 | Fair 29.6% |
| Cubans | 20.8 /100 | #199 | Fair 29.6% |
| Panamanians | 20.0 /100 | #200 | Fair 29.6% |
| Belgians | 18.8 /100 | #201 | Poor 29.7% |
| Malaysians | 17.4 /100 | #202 | Poor 29.7% |
| Swiss | 17.2 /100 | #203 | Poor 29.7% |
| Immigrants | Immigrants | 16.6 /100 | #204 | Poor 29.7% |
| Czechoslovakians | 16.1 /100 | #205 | Poor 29.7% |
| Immigrants | Haiti | 15.8 /100 | #206 | Poor 29.7% |
| Immigrants | Panama | 15.5 /100 | #207 | Poor 29.8% |
| Immigrants | Guyana | 14.7 /100 | #208 | Poor 29.8% |
| Irish | 13.9 /100 | #209 | Poor 29.8% |
| Haitians | 13.3 /100 | #210 | Poor 29.8% |
| Guyanese | 12.8 /100 | #211 | Poor 29.8% |