Basque vs Ecuadorian Disability
COMPARE
Basque
Ecuadorian
Disability
Disability Comparison
Basques
Ecuadorians
12.2%
DISABILITY
1.5/ 100
METRIC RATING
244th/ 347
METRIC RANK
11.2%
DISABILITY
98.0/ 100
METRIC RATING
92nd/ 347
METRIC RANK
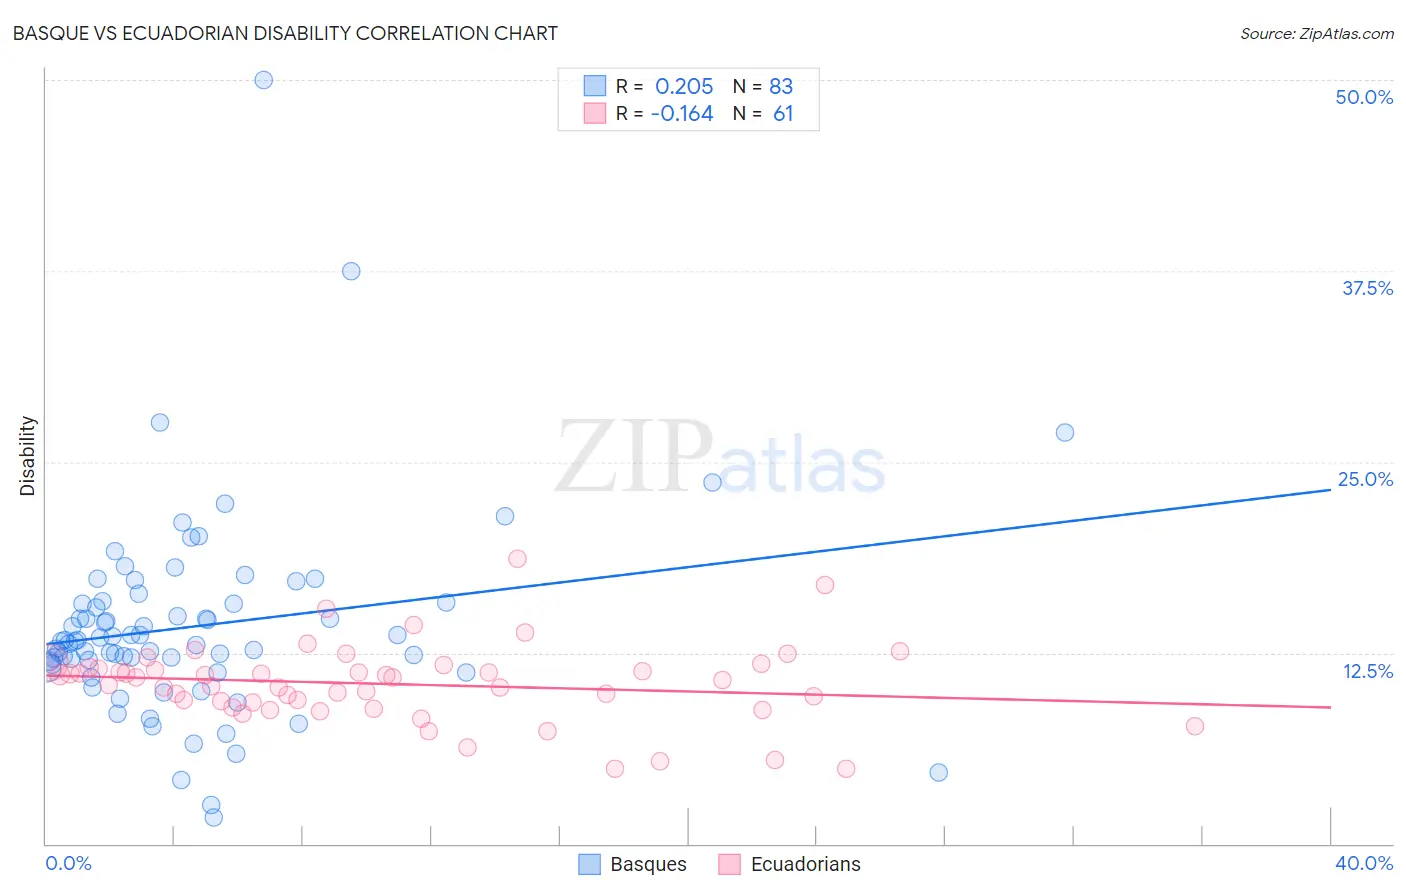
Basque vs Ecuadorian Disability Correlation Chart
The statistical analysis conducted on geographies consisting of 165,778,985 people shows a weak positive correlation between the proportion of Basques and percentage of population with a disability in the United States with a correlation coefficient (R) of 0.205 and weighted average of 12.2%. Similarly, the statistical analysis conducted on geographies consisting of 317,822,544 people shows a poor negative correlation between the proportion of Ecuadorians and percentage of population with a disability in the United States with a correlation coefficient (R) of -0.164 and weighted average of 11.2%, a difference of 9.3%.
Disability Correlation Summary
| Measurement | Basque | Ecuadorian |
| Minimum | 1.7% | 4.9% |
| Maximum | 50.0% | 18.7% |
| Range | 48.3% | 13.8% |
| Mean | 14.2% | 10.4% |
| Median | 13.3% | 10.7% |
| Interquartile 25% (IQ1) | 11.7% | 9.1% |
| Interquartile 75% (IQ3) | 15.8% | 11.5% |
| Interquartile Range (IQR) | 4.1% | 2.4% |
| Standard Deviation (Sample) | 6.6% | 2.5% |
| Standard Deviation (Population) | 6.6% | 2.5% |
Similar Demographics by Disability
Demographics Similar to Basques by Disability
In terms of disability, the demographic groups most similar to Basques are British (12.2%, a difference of 0.0%), Liberian (12.2%, a difference of 0.020%), Swiss (12.2%, a difference of 0.040%), Indonesian (12.2%, a difference of 0.070%), and Polish (12.2%, a difference of 0.090%).
| Demographics | Rating | Rank | Disability |
| Immigrants | Congo | 1.9 /100 | #237 | Tragic 12.2% |
| Norwegians | 1.9 /100 | #238 | Tragic 12.2% |
| Swedes | 1.8 /100 | #239 | Tragic 12.2% |
| Hungarians | 1.7 /100 | #240 | Tragic 12.2% |
| Yugoslavians | 1.7 /100 | #241 | Tragic 12.2% |
| Poles | 1.7 /100 | #242 | Tragic 12.2% |
| British | 1.5 /100 | #243 | Tragic 12.2% |
| Basques | 1.5 /100 | #244 | Tragic 12.2% |
| Liberians | 1.5 /100 | #245 | Tragic 12.2% |
| Swiss | 1.5 /100 | #246 | Tragic 12.2% |
| Indonesians | 1.4 /100 | #247 | Tragic 12.2% |
| Guamanians/Chamorros | 1.4 /100 | #248 | Tragic 12.3% |
| Carpatho Rusyns | 1.4 /100 | #249 | Tragic 12.3% |
| Sub-Saharan Africans | 1.4 /100 | #250 | Tragic 12.3% |
| Europeans | 1.4 /100 | #251 | Tragic 12.3% |
Demographics Similar to Ecuadorians by Disability
In terms of disability, the demographic groups most similar to Ecuadorians are Immigrants from Ecuador (11.2%, a difference of 0.0%), Immigrants from Western Asia (11.2%, a difference of 0.040%), Immigrants from Brazil (11.2%, a difference of 0.060%), Immigrants from South Africa (11.2%, a difference of 0.11%), and Immigrants from Morocco (11.2%, a difference of 0.12%).
| Demographics | Rating | Rank | Disability |
| Immigrants | Belarus | 98.9 /100 | #85 | Exceptional 11.1% |
| Immigrants | Russia | 98.9 /100 | #86 | Exceptional 11.1% |
| Palestinians | 98.9 /100 | #87 | Exceptional 11.1% |
| Immigrants | Romania | 98.5 /100 | #88 | Exceptional 11.2% |
| Immigrants | South Africa | 98.2 /100 | #89 | Exceptional 11.2% |
| Immigrants | Brazil | 98.1 /100 | #90 | Exceptional 11.2% |
| Immigrants | Western Asia | 98.1 /100 | #91 | Exceptional 11.2% |
| Ecuadorians | 98.0 /100 | #92 | Exceptional 11.2% |
| Immigrants | Ecuador | 98.0 /100 | #93 | Exceptional 11.2% |
| Immigrants | Morocco | 97.8 /100 | #94 | Exceptional 11.2% |
| Eastern Europeans | 97.8 /100 | #95 | Exceptional 11.2% |
| Immigrants | Zimbabwe | 97.7 /100 | #96 | Exceptional 11.2% |
| Bhutanese | 97.4 /100 | #97 | Exceptional 11.2% |
| Uruguayans | 97.4 /100 | #98 | Exceptional 11.2% |
| Immigrants | Czechoslovakia | 97.4 /100 | #99 | Exceptional 11.2% |