Ethiopian vs Ecuadorian Single Mother Poverty
COMPARE
Ethiopian
Ecuadorian
Single Mother Poverty
Single Mother Poverty Comparison
Ethiopians
Ecuadorians
27.7%
SINGLE MOTHER POVERTY
98.4/ 100
METRIC RATING
88th/ 347
METRIC RANK
30.8%
SINGLE MOTHER POVERTY
0.9/ 100
METRIC RATING
246th/ 347
METRIC RANK
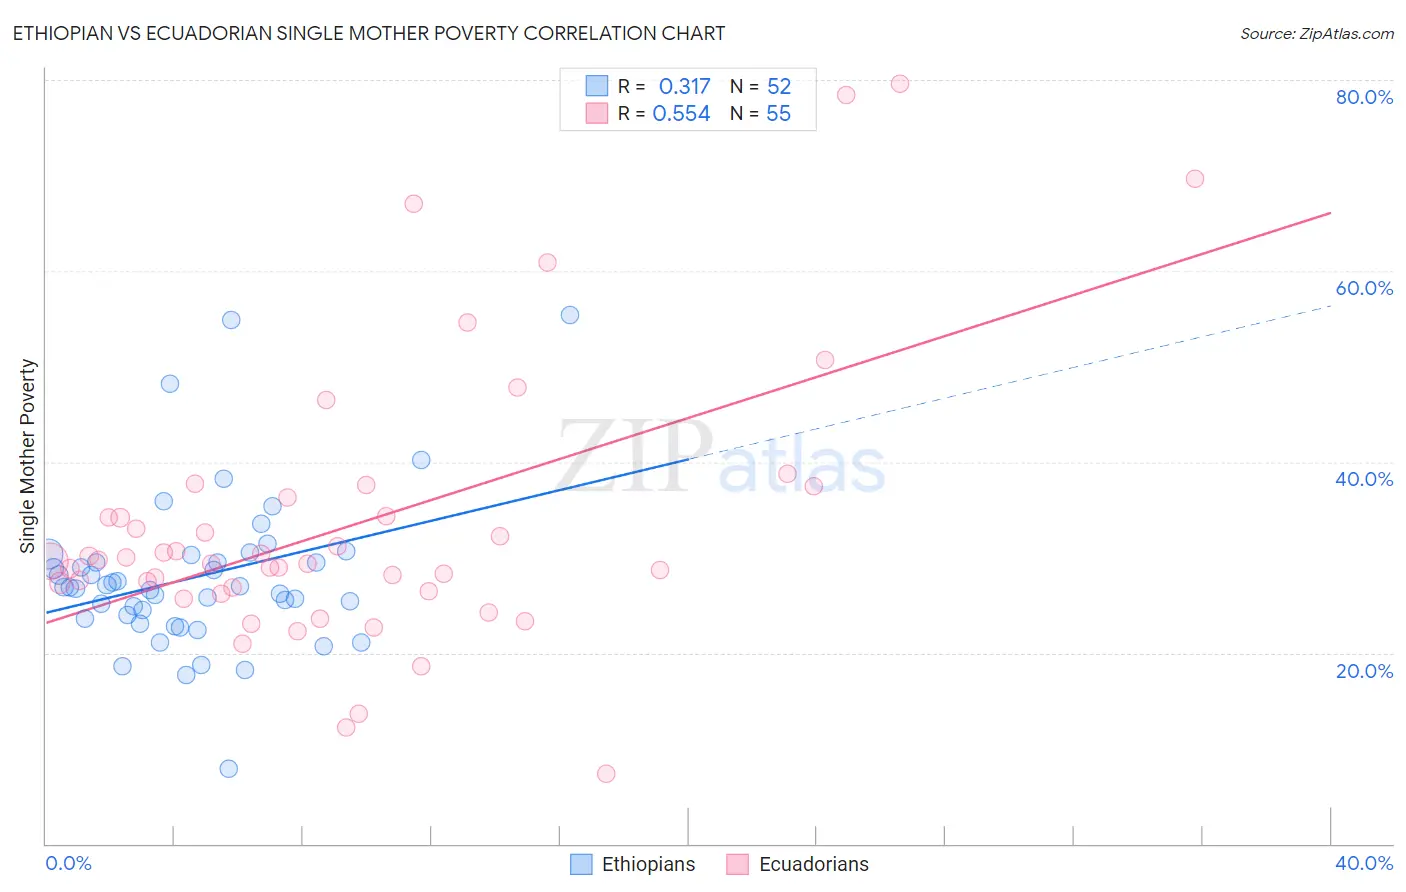
Ethiopian vs Ecuadorian Single Mother Poverty Correlation Chart
The statistical analysis conducted on geographies consisting of 220,975,245 people shows a mild positive correlation between the proportion of Ethiopians and poverty level among single mothers in the United States with a correlation coefficient (R) of 0.317 and weighted average of 27.7%. Similarly, the statistical analysis conducted on geographies consisting of 311,375,048 people shows a substantial positive correlation between the proportion of Ecuadorians and poverty level among single mothers in the United States with a correlation coefficient (R) of 0.554 and weighted average of 30.8%, a difference of 11.1%.
Single Mother Poverty Correlation Summary
| Measurement | Ethiopian | Ecuadorian |
| Minimum | 7.9% | 7.3% |
| Maximum | 55.4% | 79.6% |
| Range | 47.5% | 72.3% |
| Mean | 27.9% | 33.5% |
| Median | 26.9% | 29.6% |
| Interquartile 25% (IQ1) | 23.7% | 26.5% |
| Interquartile 75% (IQ3) | 29.9% | 36.2% |
| Interquartile Range (IQR) | 6.1% | 9.8% |
| Standard Deviation (Sample) | 8.3% | 14.7% |
| Standard Deviation (Population) | 8.2% | 14.6% |
Similar Demographics by Single Mother Poverty
Demographics Similar to Ethiopians by Single Mother Poverty
In terms of single mother poverty, the demographic groups most similar to Ethiopians are Afghan (27.7%, a difference of 0.020%), Immigrants from Ethiopia (27.7%, a difference of 0.020%), Immigrants from Ukraine (27.7%, a difference of 0.12%), Immigrants from France (27.8%, a difference of 0.19%), and Mongolian (27.7%, a difference of 0.21%).
| Demographics | Rating | Rank | Single Mother Poverty |
| Immigrants | Scotland | 98.9 /100 | #81 | Exceptional 27.6% |
| Immigrants | Cameroon | 98.8 /100 | #82 | Exceptional 27.6% |
| Greeks | 98.7 /100 | #83 | Exceptional 27.7% |
| Immigrants | Latvia | 98.7 /100 | #84 | Exceptional 27.7% |
| Mongolians | 98.7 /100 | #85 | Exceptional 27.7% |
| Immigrants | Ukraine | 98.6 /100 | #86 | Exceptional 27.7% |
| Afghans | 98.5 /100 | #87 | Exceptional 27.7% |
| Ethiopians | 98.4 /100 | #88 | Exceptional 27.7% |
| Immigrants | Ethiopia | 98.4 /100 | #89 | Exceptional 27.7% |
| Immigrants | France | 98.2 /100 | #90 | Exceptional 27.8% |
| Immigrants | Albania | 98.0 /100 | #91 | Exceptional 27.8% |
| Estonians | 97.9 /100 | #92 | Exceptional 27.8% |
| Romanians | 97.8 /100 | #93 | Exceptional 27.8% |
| Albanians | 97.6 /100 | #94 | Exceptional 27.9% |
| Chileans | 97.5 /100 | #95 | Exceptional 27.9% |
Demographics Similar to Ecuadorians by Single Mother Poverty
In terms of single mother poverty, the demographic groups most similar to Ecuadorians are West Indian (30.8%, a difference of 0.040%), French Canadian (30.8%, a difference of 0.080%), Cape Verdean (30.8%, a difference of 0.15%), Vietnamese (30.9%, a difference of 0.30%), and Barbadian (30.7%, a difference of 0.40%).
| Demographics | Rating | Rank | Single Mother Poverty |
| Immigrants | Portugal | 2.1 /100 | #239 | Tragic 30.5% |
| Salvadorans | 1.8 /100 | #240 | Tragic 30.6% |
| Immigrants | Laos | 1.8 /100 | #241 | Tragic 30.6% |
| Immigrants | Burma/Myanmar | 1.7 /100 | #242 | Tragic 30.6% |
| Bermudans | 1.6 /100 | #243 | Tragic 30.6% |
| French | 1.3 /100 | #244 | Tragic 30.7% |
| Barbadians | 1.3 /100 | #245 | Tragic 30.7% |
| Ecuadorians | 0.9 /100 | #246 | Tragic 30.8% |
| West Indians | 0.9 /100 | #247 | Tragic 30.8% |
| French Canadians | 0.9 /100 | #248 | Tragic 30.8% |
| Cape Verdeans | 0.8 /100 | #249 | Tragic 30.8% |
| Vietnamese | 0.7 /100 | #250 | Tragic 30.9% |
| Tlingit-Haida | 0.6 /100 | #251 | Tragic 30.9% |
| Alaska Natives | 0.6 /100 | #252 | Tragic 30.9% |
| Celtics | 0.6 /100 | #253 | Tragic 30.9% |