Barbadian vs Canadian Family Poverty
COMPARE
Barbadian
Canadian
Family Poverty
Family Poverty Comparison
Barbadians
Canadians
11.3%
FAMILY POVERTY
0.0/ 100
METRIC RATING
285th/ 347
METRIC RANK
8.2%
FAMILY POVERTY
94.2/ 100
METRIC RATING
113th/ 347
METRIC RANK
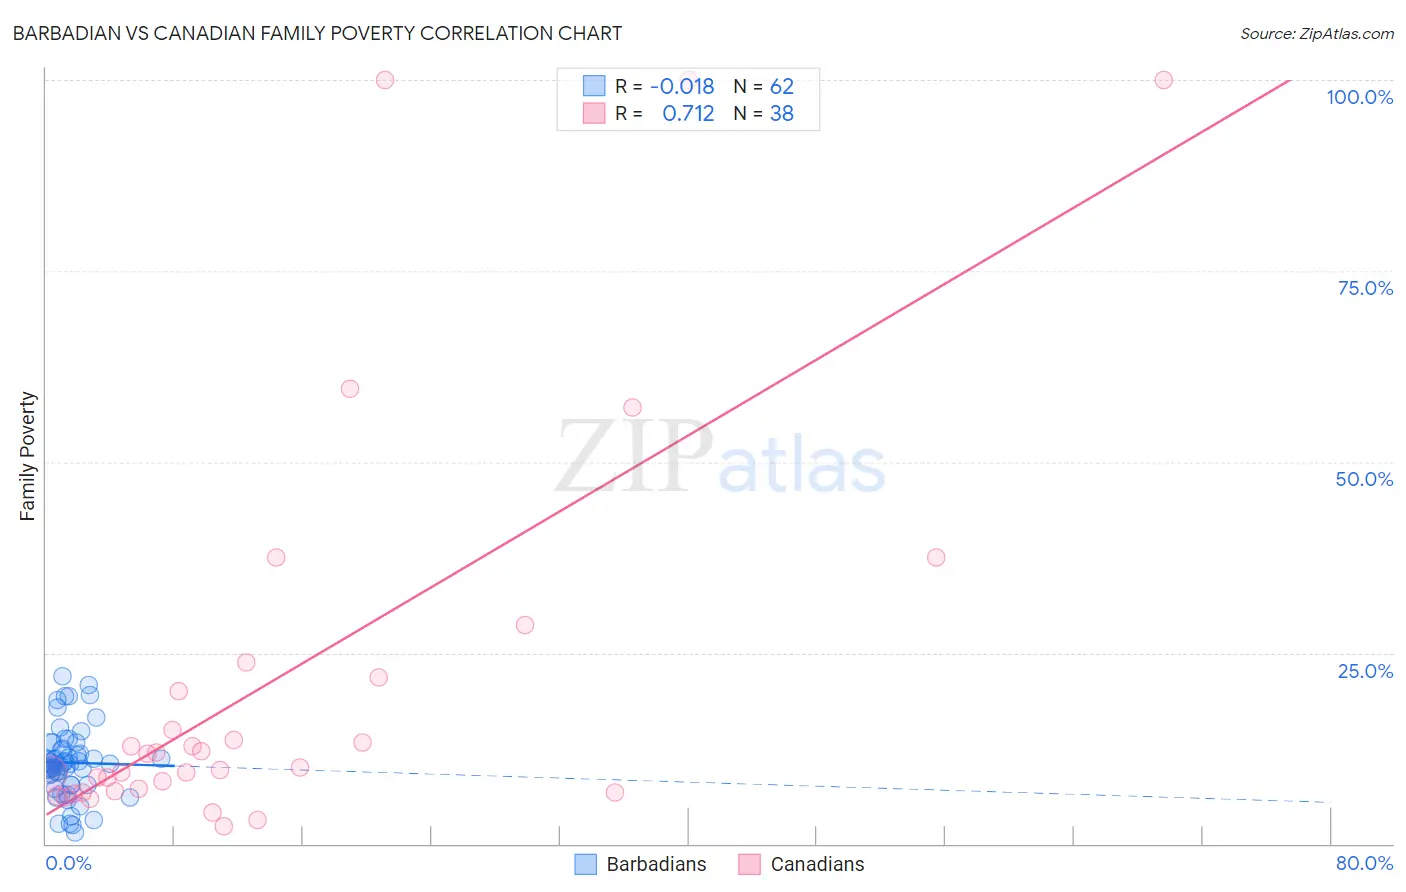
Barbadian vs Canadian Family Poverty Correlation Chart
The statistical analysis conducted on geographies consisting of 141,196,008 people shows no correlation between the proportion of Barbadians and poverty level among families in the United States with a correlation coefficient (R) of -0.018 and weighted average of 11.3%. Similarly, the statistical analysis conducted on geographies consisting of 435,772,566 people shows a strong positive correlation between the proportion of Canadians and poverty level among families in the United States with a correlation coefficient (R) of 0.712 and weighted average of 8.2%, a difference of 38.6%.
Family Poverty Correlation Summary
| Measurement | Barbadian | Canadian |
| Minimum | 1.4% | 2.3% |
| Maximum | 21.9% | 100.0% |
| Range | 20.5% | 97.7% |
| Mean | 10.6% | 21.7% |
| Median | 10.5% | 10.9% |
| Interquartile 25% (IQ1) | 7.7% | 6.9% |
| Interquartile 75% (IQ3) | 12.4% | 21.7% |
| Interquartile Range (IQR) | 4.7% | 14.9% |
| Standard Deviation (Sample) | 4.6% | 26.7% |
| Standard Deviation (Population) | 4.5% | 26.4% |
Similar Demographics by Family Poverty
Demographics Similar to Barbadians by Family Poverty
In terms of family poverty, the demographic groups most similar to Barbadians are Yaqui (11.3%, a difference of 0.080%), Indonesian (11.3%, a difference of 0.20%), Immigrants from Cuba (11.3%, a difference of 0.24%), Immigrants from West Indies (11.3%, a difference of 0.50%), and Belizean (11.3%, a difference of 0.77%).
| Demographics | Rating | Rank | Family Poverty |
| Guyanese | 0.1 /100 | #278 | Tragic 11.2% |
| Blackfeet | 0.0 /100 | #279 | Tragic 11.3% |
| Belizeans | 0.0 /100 | #280 | Tragic 11.3% |
| Immigrants | West Indies | 0.0 /100 | #281 | Tragic 11.3% |
| Immigrants | Cuba | 0.0 /100 | #282 | Tragic 11.3% |
| Indonesians | 0.0 /100 | #283 | Tragic 11.3% |
| Yaqui | 0.0 /100 | #284 | Tragic 11.3% |
| Barbadians | 0.0 /100 | #285 | Tragic 11.3% |
| Senegalese | 0.0 /100 | #286 | Tragic 11.5% |
| Vietnamese | 0.0 /100 | #287 | Tragic 11.5% |
| Immigrants | Belize | 0.0 /100 | #288 | Tragic 11.5% |
| Immigrants | Barbados | 0.0 /100 | #289 | Tragic 11.5% |
| West Indians | 0.0 /100 | #290 | Tragic 11.5% |
| Haitians | 0.0 /100 | #291 | Tragic 11.5% |
| Immigrants | Somalia | 0.0 /100 | #292 | Tragic 11.5% |
Demographics Similar to Canadians by Family Poverty
In terms of family poverty, the demographic groups most similar to Canadians are Immigrants from Zimbabwe (8.2%, a difference of 0.090%), Immigrants from France (8.2%, a difference of 0.17%), Taiwanese (8.2%, a difference of 0.28%), Romanian (8.2%, a difference of 0.33%), and Jordanian (8.2%, a difference of 0.42%).
| Demographics | Rating | Rank | Family Poverty |
| Egyptians | 95.1 /100 | #106 | Exceptional 8.1% |
| French Canadians | 95.0 /100 | #107 | Exceptional 8.1% |
| Basques | 94.9 /100 | #108 | Exceptional 8.1% |
| Jordanians | 94.8 /100 | #109 | Exceptional 8.2% |
| Romanians | 94.7 /100 | #110 | Exceptional 8.2% |
| Taiwanese | 94.6 /100 | #111 | Exceptional 8.2% |
| Immigrants | France | 94.4 /100 | #112 | Exceptional 8.2% |
| Canadians | 94.2 /100 | #113 | Exceptional 8.2% |
| Immigrants | Zimbabwe | 94.0 /100 | #114 | Exceptional 8.2% |
| Immigrants | Israel | 93.5 /100 | #115 | Exceptional 8.2% |
| South Africans | 93.4 /100 | #116 | Exceptional 8.2% |
| Immigrants | Russia | 93.2 /100 | #117 | Exceptional 8.2% |
| Immigrants | Western Europe | 92.9 /100 | #118 | Exceptional 8.2% |
| French | 92.8 /100 | #119 | Exceptional 8.3% |
| Immigrants | Egypt | 91.6 /100 | #120 | Exceptional 8.3% |