Barbadian vs Immigrants from Iran Family Poverty
COMPARE
Barbadian
Immigrants from Iran
Family Poverty
Family Poverty Comparison
Barbadians
Immigrants from Iran
11.3%
FAMILY POVERTY
0.0/ 100
METRIC RATING
285th/ 347
METRIC RANK
7.3%
FAMILY POVERTY
99.7/ 100
METRIC RATING
21st/ 347
METRIC RANK
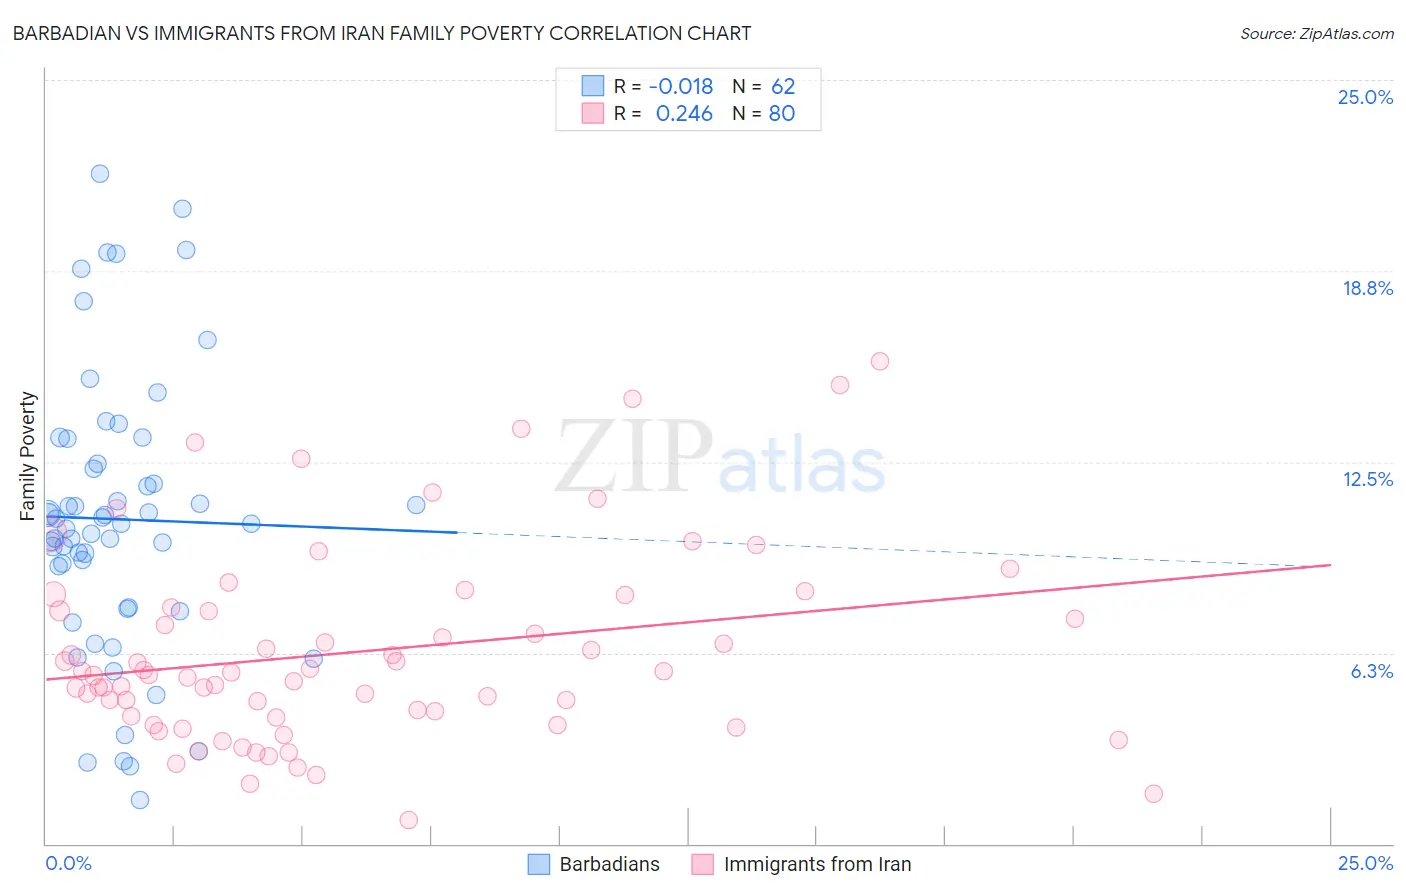
Barbadian vs Immigrants from Iran Family Poverty Correlation Chart
The statistical analysis conducted on geographies consisting of 141,196,008 people shows no correlation between the proportion of Barbadians and poverty level among families in the United States with a correlation coefficient (R) of -0.018 and weighted average of 11.3%. Similarly, the statistical analysis conducted on geographies consisting of 279,394,600 people shows a weak positive correlation between the proportion of Immigrants from Iran and poverty level among families in the United States with a correlation coefficient (R) of 0.246 and weighted average of 7.3%, a difference of 56.1%.
Family Poverty Correlation Summary
| Measurement | Barbadian | Immigrants from Iran |
| Minimum | 1.4% | 0.76% |
| Maximum | 21.9% | 15.8% |
| Range | 20.5% | 15.0% |
| Mean | 10.6% | 6.3% |
| Median | 10.5% | 5.6% |
| Interquartile 25% (IQ1) | 7.7% | 4.2% |
| Interquartile 75% (IQ3) | 12.4% | 7.7% |
| Interquartile Range (IQR) | 4.7% | 3.5% |
| Standard Deviation (Sample) | 4.6% | 3.2% |
| Standard Deviation (Population) | 4.5% | 3.2% |
Similar Demographics by Family Poverty
Demographics Similar to Barbadians by Family Poverty
In terms of family poverty, the demographic groups most similar to Barbadians are Yaqui (11.3%, a difference of 0.080%), Indonesian (11.3%, a difference of 0.20%), Immigrants from Cuba (11.3%, a difference of 0.24%), Immigrants from West Indies (11.3%, a difference of 0.50%), and Belizean (11.3%, a difference of 0.77%).
| Demographics | Rating | Rank | Family Poverty |
| Guyanese | 0.1 /100 | #278 | Tragic 11.2% |
| Blackfeet | 0.0 /100 | #279 | Tragic 11.3% |
| Belizeans | 0.0 /100 | #280 | Tragic 11.3% |
| Immigrants | West Indies | 0.0 /100 | #281 | Tragic 11.3% |
| Immigrants | Cuba | 0.0 /100 | #282 | Tragic 11.3% |
| Indonesians | 0.0 /100 | #283 | Tragic 11.3% |
| Yaqui | 0.0 /100 | #284 | Tragic 11.3% |
| Barbadians | 0.0 /100 | #285 | Tragic 11.3% |
| Senegalese | 0.0 /100 | #286 | Tragic 11.5% |
| Vietnamese | 0.0 /100 | #287 | Tragic 11.5% |
| Immigrants | Belize | 0.0 /100 | #288 | Tragic 11.5% |
| Immigrants | Barbados | 0.0 /100 | #289 | Tragic 11.5% |
| West Indians | 0.0 /100 | #290 | Tragic 11.5% |
| Haitians | 0.0 /100 | #291 | Tragic 11.5% |
| Immigrants | Somalia | 0.0 /100 | #292 | Tragic 11.5% |
Demographics Similar to Immigrants from Iran by Family Poverty
In terms of family poverty, the demographic groups most similar to Immigrants from Iran are Immigrants from Hong Kong (7.3%, a difference of 0.20%), Eastern European (7.2%, a difference of 0.36%), Danish (7.3%, a difference of 0.44%), Assyrian/Chaldean/Syriac (7.3%, a difference of 0.45%), and Immigrants from Lithuania (7.2%, a difference of 0.67%).
| Demographics | Rating | Rank | Family Poverty |
| Iranians | 99.8 /100 | #14 | Exceptional 7.1% |
| Lithuanians | 99.8 /100 | #15 | Exceptional 7.2% |
| Immigrants | South Central Asia | 99.8 /100 | #16 | Exceptional 7.2% |
| Luxembourgers | 99.8 /100 | #17 | Exceptional 7.2% |
| Immigrants | Lithuania | 99.8 /100 | #18 | Exceptional 7.2% |
| Eastern Europeans | 99.7 /100 | #19 | Exceptional 7.2% |
| Immigrants | Hong Kong | 99.7 /100 | #20 | Exceptional 7.3% |
| Immigrants | Iran | 99.7 /100 | #21 | Exceptional 7.3% |
| Danes | 99.7 /100 | #22 | Exceptional 7.3% |
| Assyrians/Chaldeans/Syriacs | 99.7 /100 | #23 | Exceptional 7.3% |
| Croatians | 99.7 /100 | #24 | Exceptional 7.3% |
| Burmese | 99.7 /100 | #25 | Exceptional 7.3% |
| Cypriots | 99.6 /100 | #26 | Exceptional 7.3% |
| Immigrants | Scotland | 99.6 /100 | #27 | Exceptional 7.3% |
| Immigrants | Korea | 99.6 /100 | #28 | Exceptional 7.4% |