Barbadian vs Immigrants from Austria Family Poverty
COMPARE
Barbadian
Immigrants from Austria
Family Poverty
Family Poverty Comparison
Barbadians
Immigrants from Austria
11.3%
FAMILY POVERTY
0.0/ 100
METRIC RATING
285th/ 347
METRIC RANK
7.6%
FAMILY POVERTY
99.1/ 100
METRIC RATING
43rd/ 347
METRIC RANK
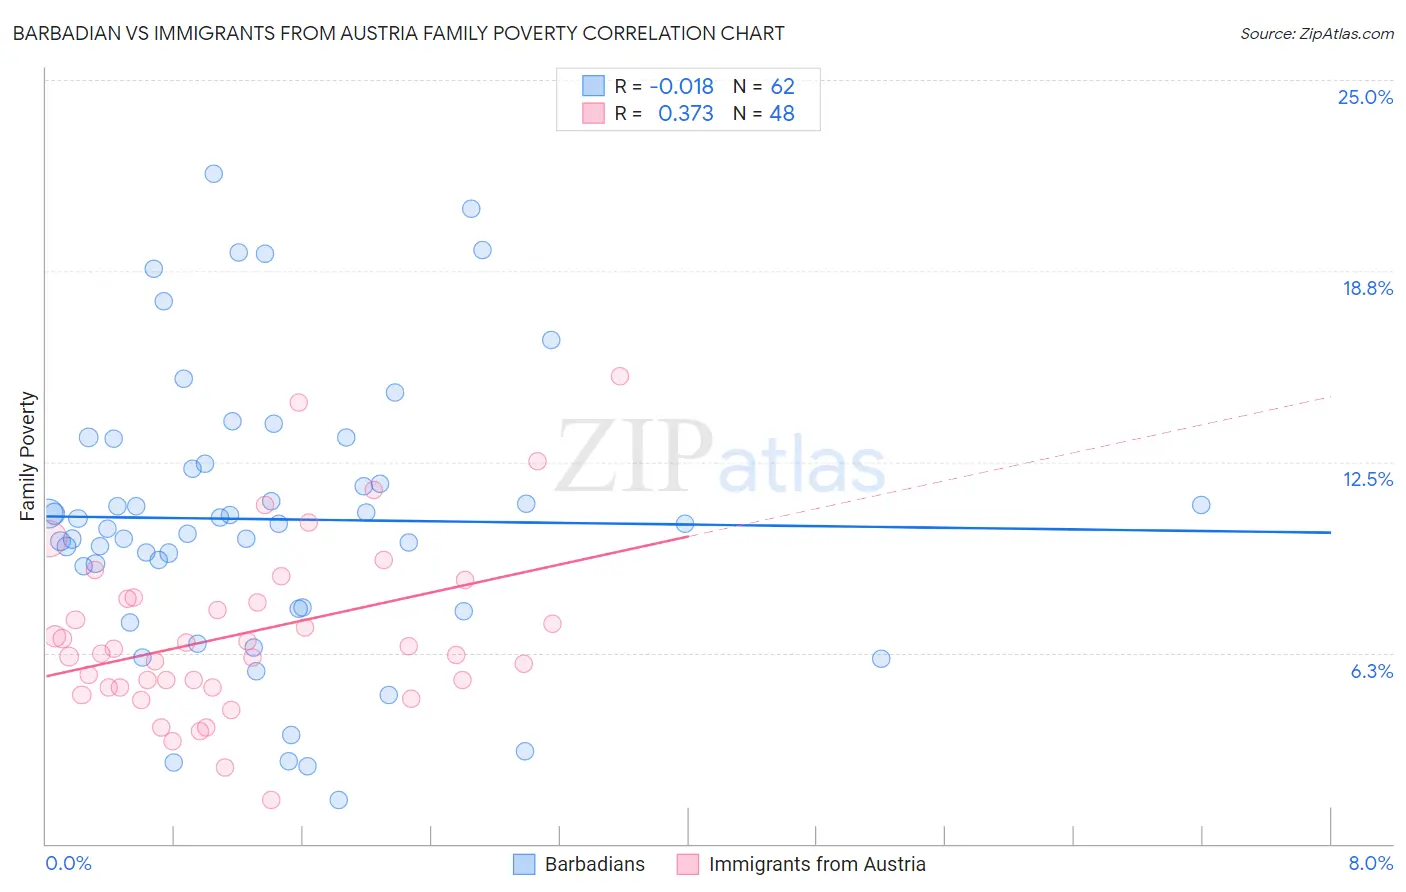
Barbadian vs Immigrants from Austria Family Poverty Correlation Chart
The statistical analysis conducted on geographies consisting of 141,196,008 people shows no correlation between the proportion of Barbadians and poverty level among families in the United States with a correlation coefficient (R) of -0.018 and weighted average of 11.3%. Similarly, the statistical analysis conducted on geographies consisting of 167,754,432 people shows a mild positive correlation between the proportion of Immigrants from Austria and poverty level among families in the United States with a correlation coefficient (R) of 0.373 and weighted average of 7.6%, a difference of 48.6%.
Family Poverty Correlation Summary
| Measurement | Barbadian | Immigrants from Austria |
| Minimum | 1.4% | 1.4% |
| Maximum | 21.9% | 15.3% |
| Range | 20.5% | 13.9% |
| Mean | 10.6% | 6.9% |
| Median | 10.5% | 6.3% |
| Interquartile 25% (IQ1) | 7.7% | 5.1% |
| Interquartile 75% (IQ3) | 12.4% | 8.0% |
| Interquartile Range (IQR) | 4.7% | 2.9% |
| Standard Deviation (Sample) | 4.6% | 2.8% |
| Standard Deviation (Population) | 4.5% | 2.8% |
Similar Demographics by Family Poverty
Demographics Similar to Barbadians by Family Poverty
In terms of family poverty, the demographic groups most similar to Barbadians are Yaqui (11.3%, a difference of 0.080%), Indonesian (11.3%, a difference of 0.20%), Immigrants from Cuba (11.3%, a difference of 0.24%), Immigrants from West Indies (11.3%, a difference of 0.50%), and Belizean (11.3%, a difference of 0.77%).
| Demographics | Rating | Rank | Family Poverty |
| Guyanese | 0.1 /100 | #278 | Tragic 11.2% |
| Blackfeet | 0.0 /100 | #279 | Tragic 11.3% |
| Belizeans | 0.0 /100 | #280 | Tragic 11.3% |
| Immigrants | West Indies | 0.0 /100 | #281 | Tragic 11.3% |
| Immigrants | Cuba | 0.0 /100 | #282 | Tragic 11.3% |
| Indonesians | 0.0 /100 | #283 | Tragic 11.3% |
| Yaqui | 0.0 /100 | #284 | Tragic 11.3% |
| Barbadians | 0.0 /100 | #285 | Tragic 11.3% |
| Senegalese | 0.0 /100 | #286 | Tragic 11.5% |
| Vietnamese | 0.0 /100 | #287 | Tragic 11.5% |
| Immigrants | Belize | 0.0 /100 | #288 | Tragic 11.5% |
| Immigrants | Barbados | 0.0 /100 | #289 | Tragic 11.5% |
| West Indians | 0.0 /100 | #290 | Tragic 11.5% |
| Haitians | 0.0 /100 | #291 | Tragic 11.5% |
| Immigrants | Somalia | 0.0 /100 | #292 | Tragic 11.5% |
Demographics Similar to Immigrants from Austria by Family Poverty
In terms of family poverty, the demographic groups most similar to Immigrants from Austria are Scandinavian (7.6%, a difference of 0.24%), German (7.7%, a difference of 0.29%), Okinawan (7.7%, a difference of 0.41%), Tongan (7.7%, a difference of 0.43%), and Immigrants from Czechoslovakia (7.7%, a difference of 0.44%).
| Demographics | Rating | Rank | Family Poverty |
| Turks | 99.4 /100 | #36 | Exceptional 7.5% |
| Estonians | 99.4 /100 | #37 | Exceptional 7.5% |
| Bolivians | 99.3 /100 | #38 | Exceptional 7.5% |
| Carpatho Rusyns | 99.3 /100 | #39 | Exceptional 7.5% |
| Slovenes | 99.3 /100 | #40 | Exceptional 7.5% |
| Immigrants | Australia | 99.2 /100 | #41 | Exceptional 7.6% |
| Scandinavians | 99.1 /100 | #42 | Exceptional 7.6% |
| Immigrants | Austria | 99.1 /100 | #43 | Exceptional 7.6% |
| Germans | 99.0 /100 | #44 | Exceptional 7.7% |
| Okinawans | 98.9 /100 | #45 | Exceptional 7.7% |
| Tongans | 98.9 /100 | #46 | Exceptional 7.7% |
| Immigrants | Czechoslovakia | 98.9 /100 | #47 | Exceptional 7.7% |
| Immigrants | Sri Lanka | 98.9 /100 | #48 | Exceptional 7.7% |
| Immigrants | Bolivia | 98.9 /100 | #49 | Exceptional 7.7% |
| Immigrants | North Macedonia | 98.9 /100 | #50 | Exceptional 7.7% |