Bangladeshi vs Immigrants from Northern Africa Male Poverty
COMPARE
Bangladeshi
Immigrants from Northern Africa
Male Poverty
Male Poverty Comparison
Bangladeshis
Immigrants from Northern Africa
13.6%
MALE POVERTY
0.0/ 100
METRIC RATING
277th/ 347
METRIC RANK
11.1%
MALE POVERTY
59.7/ 100
METRIC RATING
161st/ 347
METRIC RANK
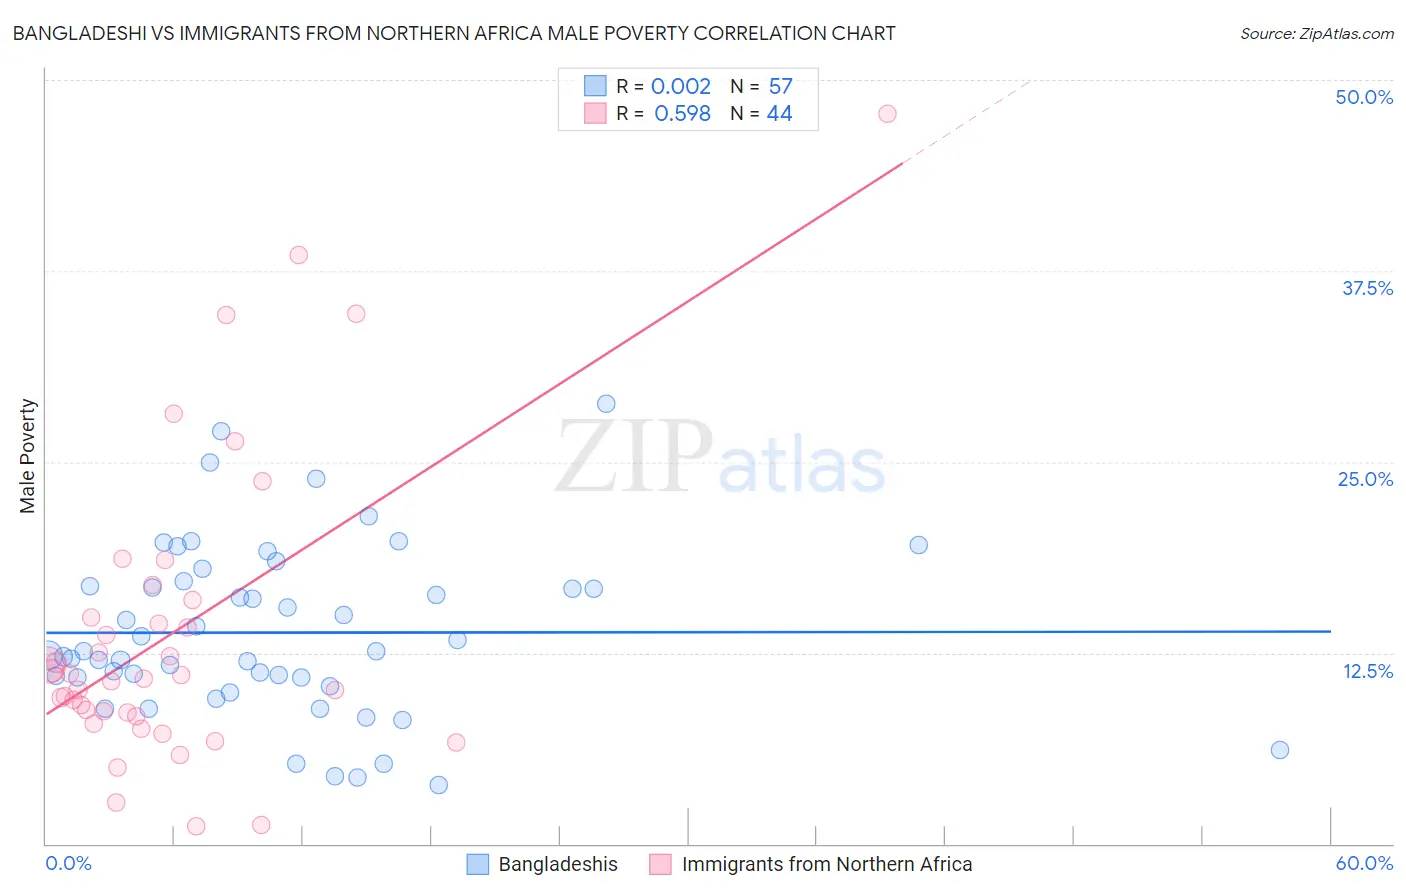
Bangladeshi vs Immigrants from Northern Africa Male Poverty Correlation Chart
The statistical analysis conducted on geographies consisting of 141,334,691 people shows no correlation between the proportion of Bangladeshis and poverty level among males in the United States with a correlation coefficient (R) of 0.002 and weighted average of 13.6%. Similarly, the statistical analysis conducted on geographies consisting of 320,989,271 people shows a substantial positive correlation between the proportion of Immigrants from Northern Africa and poverty level among males in the United States with a correlation coefficient (R) of 0.598 and weighted average of 11.1%, a difference of 23.0%.
Male Poverty Correlation Summary
| Measurement | Bangladeshi | Immigrants from Northern Africa |
| Minimum | 3.9% | 1.1% |
| Maximum | 28.8% | 47.8% |
| Range | 24.9% | 46.7% |
| Mean | 13.8% | 13.8% |
| Median | 12.6% | 10.9% |
| Interquartile 25% (IQ1) | 10.6% | 8.5% |
| Interquartile 75% (IQ3) | 17.0% | 15.4% |
| Interquartile Range (IQR) | 6.4% | 6.9% |
| Standard Deviation (Sample) | 5.6% | 9.9% |
| Standard Deviation (Population) | 5.5% | 9.8% |
Similar Demographics by Male Poverty
Demographics Similar to Bangladeshis by Male Poverty
In terms of male poverty, the demographic groups most similar to Bangladeshis are Belizean (13.6%, a difference of 0.10%), Immigrants from Latin America (13.6%, a difference of 0.15%), Haitian (13.7%, a difference of 0.27%), Barbadian (13.6%, a difference of 0.34%), and Mexican (13.7%, a difference of 0.37%).
| Demographics | Rating | Rank | Male Poverty |
| Cree | 0.0 /100 | #270 | Tragic 13.3% |
| Spanish Americans | 0.0 /100 | #271 | Tragic 13.4% |
| Immigrants | Bahamas | 0.0 /100 | #272 | Tragic 13.5% |
| Chickasaw | 0.0 /100 | #273 | Tragic 13.5% |
| Immigrants | West Indies | 0.0 /100 | #274 | Tragic 13.5% |
| Barbadians | 0.0 /100 | #275 | Tragic 13.6% |
| Immigrants | Latin America | 0.0 /100 | #276 | Tragic 13.6% |
| Bangladeshis | 0.0 /100 | #277 | Tragic 13.6% |
| Belizeans | 0.0 /100 | #278 | Tragic 13.6% |
| Haitians | 0.0 /100 | #279 | Tragic 13.7% |
| Mexicans | 0.0 /100 | #280 | Tragic 13.7% |
| Yaqui | 0.0 /100 | #281 | Tragic 13.7% |
| Immigrants | Cabo Verde | 0.0 /100 | #282 | Tragic 13.7% |
| Comanche | 0.0 /100 | #283 | Tragic 13.8% |
| Immigrants | Haiti | 0.0 /100 | #284 | Tragic 13.8% |
Demographics Similar to Immigrants from Northern Africa by Male Poverty
In terms of male poverty, the demographic groups most similar to Immigrants from Northern Africa are Soviet Union (11.1%, a difference of 0.070%), Immigrants from Chile (11.1%, a difference of 0.23%), White/Caucasian (11.1%, a difference of 0.30%), Ethiopian (11.1%, a difference of 0.30%), and Taiwanese (11.0%, a difference of 0.32%).
| Demographics | Rating | Rank | Male Poverty |
| Immigrants | Kazakhstan | 64.8 /100 | #154 | Good 11.0% |
| Immigrants | Malaysia | 64.7 /100 | #155 | Good 11.0% |
| Costa Ricans | 63.9 /100 | #156 | Good 11.0% |
| Scotch-Irish | 63.7 /100 | #157 | Good 11.0% |
| Colombians | 63.0 /100 | #158 | Good 11.0% |
| Taiwanese | 62.7 /100 | #159 | Good 11.0% |
| Soviet Union | 60.3 /100 | #160 | Good 11.1% |
| Immigrants | Northern Africa | 59.7 /100 | #161 | Average 11.1% |
| Immigrants | Chile | 57.4 /100 | #162 | Average 11.1% |
| Whites/Caucasians | 56.7 /100 | #163 | Average 11.1% |
| Ethiopians | 56.7 /100 | #164 | Average 11.1% |
| Immigrants | Spain | 55.5 /100 | #165 | Average 11.1% |
| Immigrants | Albania | 55.3 /100 | #166 | Average 11.1% |
| Hungarians | 55.1 /100 | #167 | Average 11.1% |
| Immigrants | Portugal | 54.9 /100 | #168 | Average 11.1% |