Bangladeshi vs Italian Male Poverty
COMPARE
Bangladeshi
Italian
Male Poverty
Male Poverty Comparison
Bangladeshis
Italians
13.6%
MALE POVERTY
0.0/ 100
METRIC RATING
277th/ 347
METRIC RANK
9.6%
MALE POVERTY
99.7/ 100
METRIC RATING
23rd/ 347
METRIC RANK
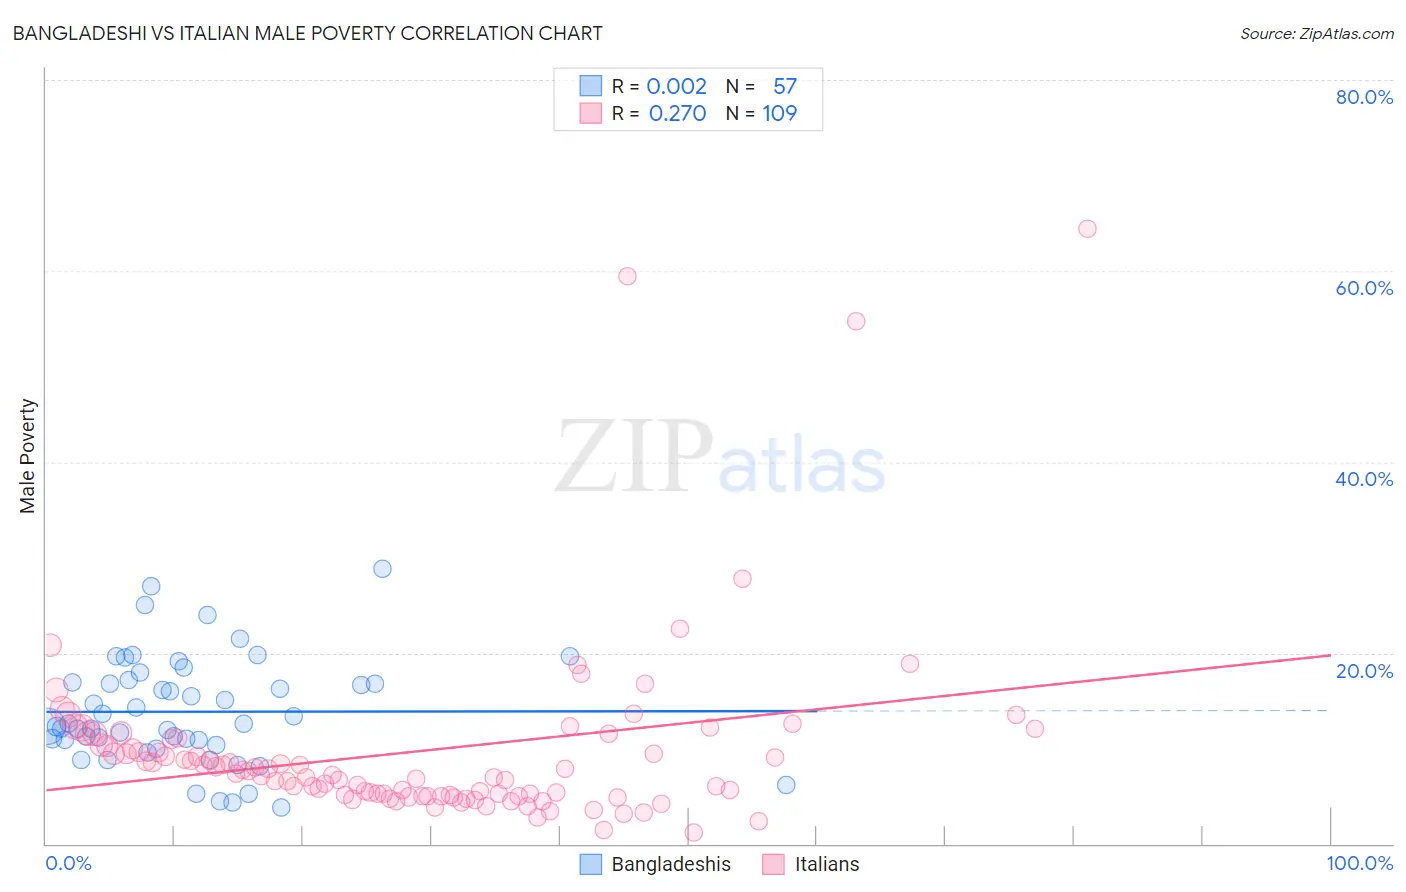
Bangladeshi vs Italian Male Poverty Correlation Chart
The statistical analysis conducted on geographies consisting of 141,334,691 people shows no correlation between the proportion of Bangladeshis and poverty level among males in the United States with a correlation coefficient (R) of 0.002 and weighted average of 13.6%. Similarly, the statistical analysis conducted on geographies consisting of 573,221,501 people shows a weak positive correlation between the proportion of Italians and poverty level among males in the United States with a correlation coefficient (R) of 0.270 and weighted average of 9.6%, a difference of 41.7%.
Male Poverty Correlation Summary
| Measurement | Bangladeshi | Italian |
| Minimum | 3.9% | 1.2% |
| Maximum | 28.8% | 64.4% |
| Range | 24.9% | 63.1% |
| Mean | 13.8% | 9.6% |
| Median | 12.6% | 7.3% |
| Interquartile 25% (IQ1) | 10.6% | 5.1% |
| Interquartile 75% (IQ3) | 17.0% | 10.7% |
| Interquartile Range (IQR) | 6.4% | 5.6% |
| Standard Deviation (Sample) | 5.6% | 9.6% |
| Standard Deviation (Population) | 5.5% | 9.5% |
Similar Demographics by Male Poverty
Demographics Similar to Bangladeshis by Male Poverty
In terms of male poverty, the demographic groups most similar to Bangladeshis are Belizean (13.6%, a difference of 0.10%), Immigrants from Latin America (13.6%, a difference of 0.15%), Haitian (13.7%, a difference of 0.27%), Barbadian (13.6%, a difference of 0.34%), and Mexican (13.7%, a difference of 0.37%).
| Demographics | Rating | Rank | Male Poverty |
| Cree | 0.0 /100 | #270 | Tragic 13.3% |
| Spanish Americans | 0.0 /100 | #271 | Tragic 13.4% |
| Immigrants | Bahamas | 0.0 /100 | #272 | Tragic 13.5% |
| Chickasaw | 0.0 /100 | #273 | Tragic 13.5% |
| Immigrants | West Indies | 0.0 /100 | #274 | Tragic 13.5% |
| Barbadians | 0.0 /100 | #275 | Tragic 13.6% |
| Immigrants | Latin America | 0.0 /100 | #276 | Tragic 13.6% |
| Bangladeshis | 0.0 /100 | #277 | Tragic 13.6% |
| Belizeans | 0.0 /100 | #278 | Tragic 13.6% |
| Haitians | 0.0 /100 | #279 | Tragic 13.7% |
| Mexicans | 0.0 /100 | #280 | Tragic 13.7% |
| Yaqui | 0.0 /100 | #281 | Tragic 13.7% |
| Immigrants | Cabo Verde | 0.0 /100 | #282 | Tragic 13.7% |
| Comanche | 0.0 /100 | #283 | Tragic 13.8% |
| Immigrants | Haiti | 0.0 /100 | #284 | Tragic 13.8% |
Demographics Similar to Italians by Male Poverty
In terms of male poverty, the demographic groups most similar to Italians are Croatian (9.6%, a difference of 0.010%), Swedish (9.6%, a difference of 0.080%), Eastern European (9.6%, a difference of 0.22%), Immigrants from Scotland (9.6%, a difference of 0.26%), and Latvian (9.6%, a difference of 0.52%).
| Demographics | Rating | Rank | Male Poverty |
| Luxembourgers | 99.8 /100 | #16 | Exceptional 9.5% |
| Norwegians | 99.8 /100 | #17 | Exceptional 9.5% |
| Lithuanians | 99.8 /100 | #18 | Exceptional 9.5% |
| Immigrants | Hong Kong | 99.7 /100 | #19 | Exceptional 9.6% |
| Latvians | 99.7 /100 | #20 | Exceptional 9.6% |
| Immigrants | Scotland | 99.7 /100 | #21 | Exceptional 9.6% |
| Croatians | 99.7 /100 | #22 | Exceptional 9.6% |
| Italians | 99.7 /100 | #23 | Exceptional 9.6% |
| Swedes | 99.7 /100 | #24 | Exceptional 9.6% |
| Eastern Europeans | 99.6 /100 | #25 | Exceptional 9.6% |
| Burmese | 99.6 /100 | #26 | Exceptional 9.7% |
| Danes | 99.6 /100 | #27 | Exceptional 9.7% |
| Immigrants | Korea | 99.6 /100 | #28 | Exceptional 9.7% |
| Greeks | 99.6 /100 | #29 | Exceptional 9.7% |
| Poles | 99.5 /100 | #30 | Exceptional 9.7% |