Bangladeshi vs Immigrants from Northern Africa Median Male Earnings
COMPARE
Bangladeshi
Immigrants from Northern Africa
Median Male Earnings
Median Male Earnings Comparison
Bangladeshis
Immigrants from Northern Africa
$46,744
MEDIAN MALE EARNINGS
0.1/ 100
METRIC RATING
304th/ 347
METRIC RANK
$58,008
MEDIAN MALE EARNINGS
96.9/ 100
METRIC RATING
106th/ 347
METRIC RANK
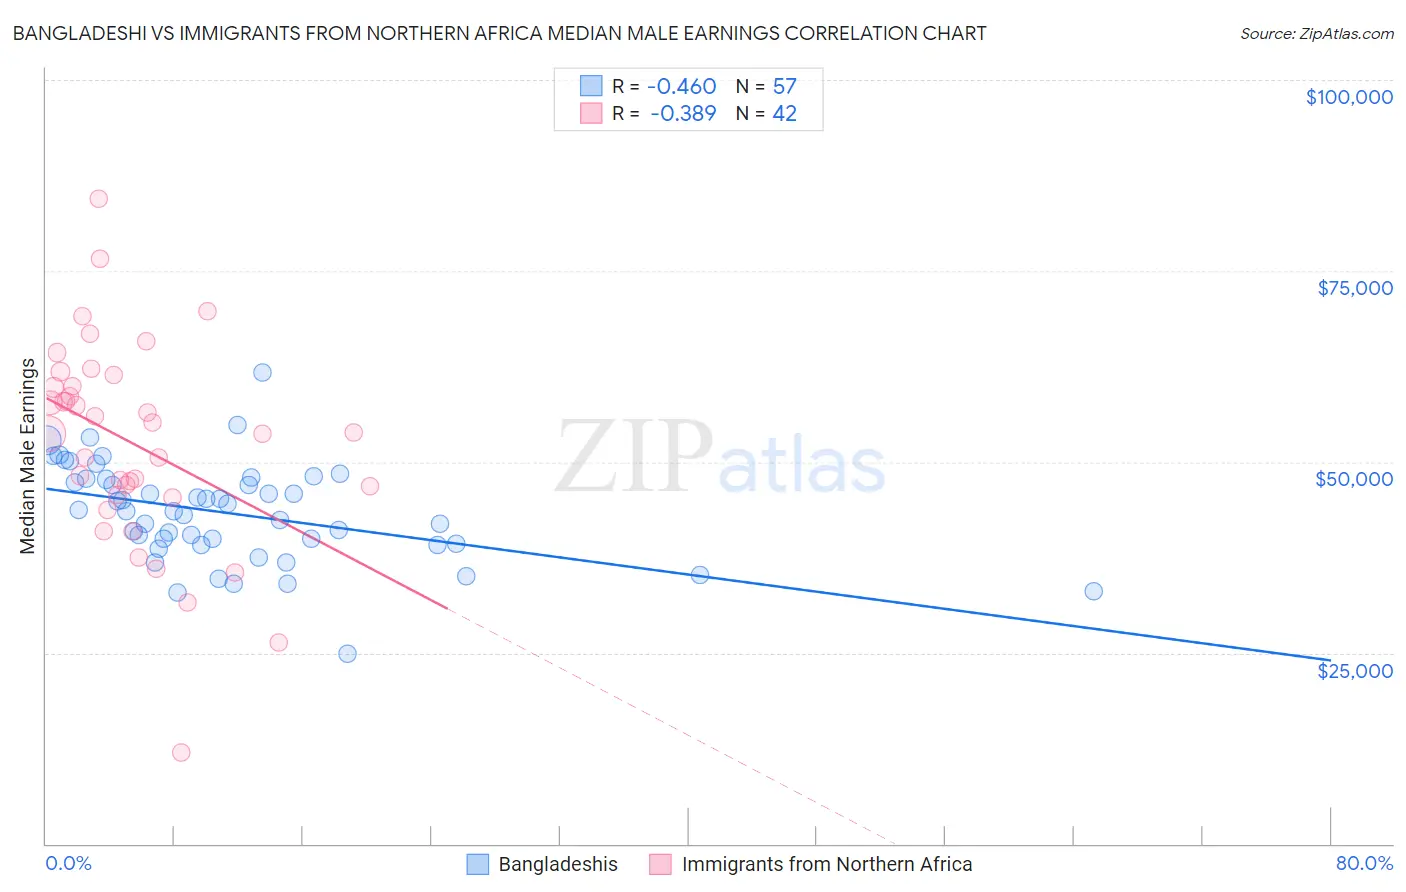
Bangladeshi vs Immigrants from Northern Africa Median Male Earnings Correlation Chart
The statistical analysis conducted on geographies consisting of 141,442,222 people shows a moderate negative correlation between the proportion of Bangladeshis and median male earnings in the United States with a correlation coefficient (R) of -0.460 and weighted average of $46,744. Similarly, the statistical analysis conducted on geographies consisting of 321,143,367 people shows a mild negative correlation between the proportion of Immigrants from Northern Africa and median male earnings in the United States with a correlation coefficient (R) of -0.389 and weighted average of $58,008, a difference of 24.1%.
Median Male Earnings Correlation Summary
| Measurement | Bangladeshi | Immigrants from Northern Africa |
| Minimum | $24,888 | $12,000 |
| Maximum | $61,776 | $84,392 |
| Range | $36,888 | $72,392 |
| Mean | $43,307 | $52,417 |
| Median | $43,611 | $53,736 |
| Interquartile 25% (IQ1) | $39,220 | $45,608 |
| Interquartile 75% (IQ3) | $47,786 | $59,910 |
| Interquartile Range (IQR) | $8,565 | $14,302 |
| Standard Deviation (Sample) | $6,481 | $13,421 |
| Standard Deviation (Population) | $6,424 | $13,260 |
Similar Demographics by Median Male Earnings
Demographics Similar to Bangladeshis by Median Male Earnings
In terms of median male earnings, the demographic groups most similar to Bangladeshis are Guatemalan ($46,736, a difference of 0.020%), Yaqui ($46,777, a difference of 0.070%), Seminole ($46,783, a difference of 0.080%), Dutch West Indian ($46,656, a difference of 0.19%), and Immigrants from Dominican Republic ($46,655, a difference of 0.19%).
| Demographics | Rating | Rank | Median Male Earnings |
| Dominicans | 0.1 /100 | #297 | Tragic $47,204 |
| Immigrants | Micronesia | 0.1 /100 | #298 | Tragic $47,177 |
| Immigrants | Zaire | 0.1 /100 | #299 | Tragic $47,070 |
| U.S. Virgin Islanders | 0.1 /100 | #300 | Tragic $47,066 |
| Immigrants | Latin America | 0.1 /100 | #301 | Tragic $46,941 |
| Seminole | 0.1 /100 | #302 | Tragic $46,783 |
| Yaqui | 0.1 /100 | #303 | Tragic $46,777 |
| Bangladeshis | 0.1 /100 | #304 | Tragic $46,744 |
| Guatemalans | 0.0 /100 | #305 | Tragic $46,736 |
| Dutch West Indians | 0.0 /100 | #306 | Tragic $46,656 |
| Immigrants | Dominican Republic | 0.0 /100 | #307 | Tragic $46,655 |
| Ottawa | 0.0 /100 | #308 | Tragic $46,611 |
| Creek | 0.0 /100 | #309 | Tragic $46,594 |
| Cubans | 0.0 /100 | #310 | Tragic $46,580 |
| Apache | 0.0 /100 | #311 | Tragic $46,429 |
Demographics Similar to Immigrants from Northern Africa by Median Male Earnings
In terms of median male earnings, the demographic groups most similar to Immigrants from Northern Africa are Serbian ($57,975, a difference of 0.060%), Immigrants from Uzbekistan ($57,941, a difference of 0.12%), British ($57,890, a difference of 0.20%), Immigrants from Western Asia ($58,131, a difference of 0.21%), and Armenian ($58,134, a difference of 0.22%).
| Demographics | Rating | Rank | Median Male Earnings |
| Immigrants | Poland | 98.0 /100 | #99 | Exceptional $58,452 |
| Assyrians/Chaldeans/Syriacs | 97.9 /100 | #100 | Exceptional $58,437 |
| Immigrants | Brazil | 97.7 /100 | #101 | Exceptional $58,324 |
| Syrians | 97.4 /100 | #102 | Exceptional $58,187 |
| Poles | 97.3 /100 | #103 | Exceptional $58,139 |
| Armenians | 97.3 /100 | #104 | Exceptional $58,134 |
| Immigrants | Western Asia | 97.3 /100 | #105 | Exceptional $58,131 |
| Immigrants | Northern Africa | 96.9 /100 | #106 | Exceptional $58,008 |
| Serbians | 96.8 /100 | #107 | Exceptional $57,975 |
| Immigrants | Uzbekistan | 96.7 /100 | #108 | Exceptional $57,941 |
| British | 96.5 /100 | #109 | Exceptional $57,890 |
| Palestinians | 96.2 /100 | #110 | Exceptional $57,778 |
| Europeans | 95.6 /100 | #111 | Exceptional $57,637 |
| Immigrants | Afghanistan | 95.4 /100 | #112 | Exceptional $57,582 |
| Carpatho Rusyns | 95.3 /100 | #113 | Exceptional $57,572 |