Bangladeshi vs Malaysian Male Poverty
COMPARE
Bangladeshi
Malaysian
Male Poverty
Male Poverty Comparison
Bangladeshis
Malaysians
13.6%
MALE POVERTY
0.0/ 100
METRIC RATING
277th/ 347
METRIC RANK
12.0%
MALE POVERTY
5.2/ 100
METRIC RATING
207th/ 347
METRIC RANK
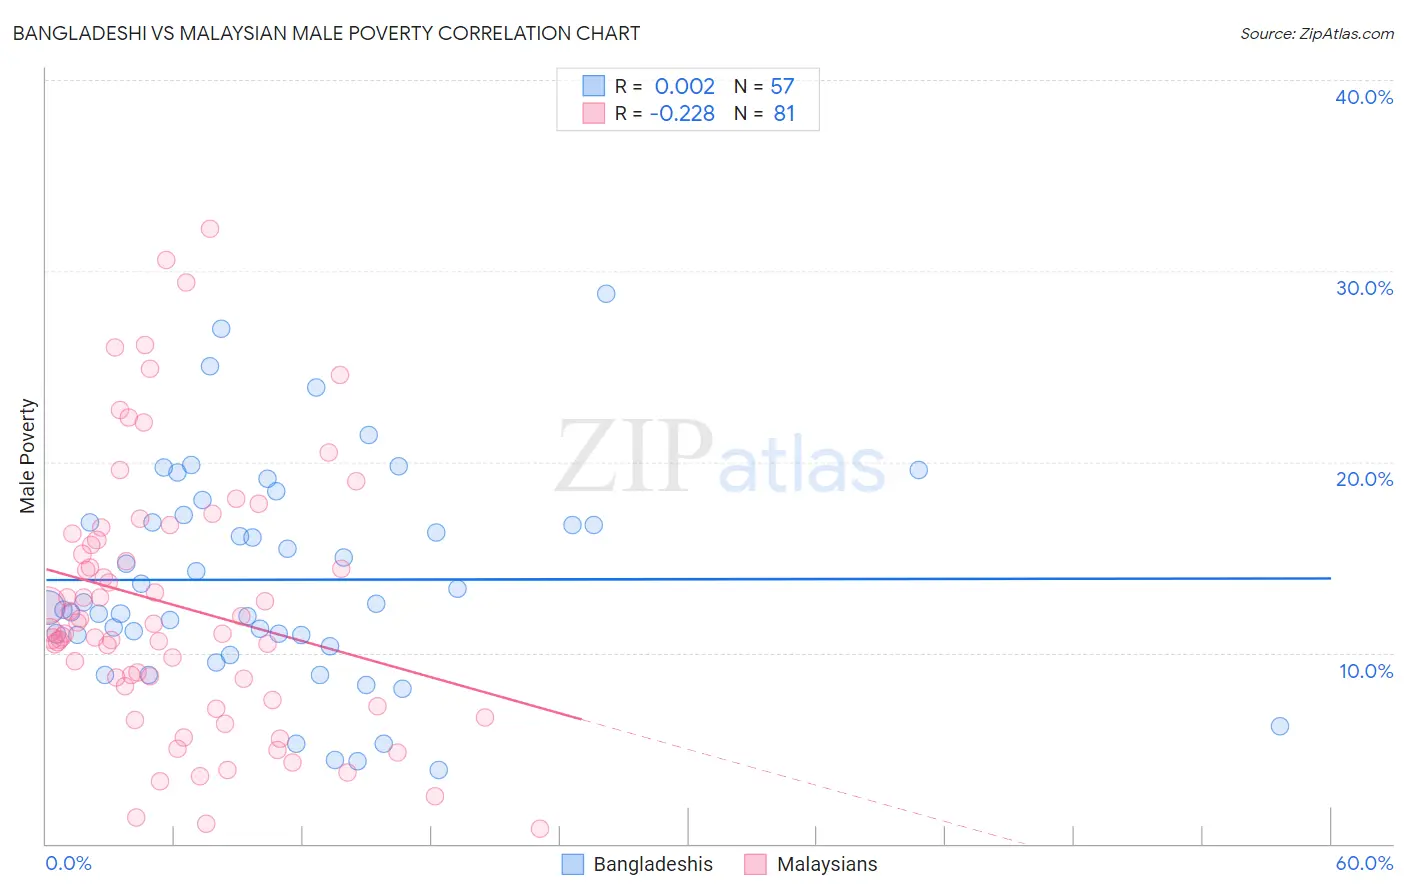
Bangladeshi vs Malaysian Male Poverty Correlation Chart
The statistical analysis conducted on geographies consisting of 141,334,691 people shows no correlation between the proportion of Bangladeshis and poverty level among males in the United States with a correlation coefficient (R) of 0.002 and weighted average of 13.6%. Similarly, the statistical analysis conducted on geographies consisting of 225,986,127 people shows a weak negative correlation between the proportion of Malaysians and poverty level among males in the United States with a correlation coefficient (R) of -0.228 and weighted average of 12.0%, a difference of 13.7%.
Male Poverty Correlation Summary
| Measurement | Bangladeshi | Malaysian |
| Minimum | 3.9% | 0.78% |
| Maximum | 28.8% | 32.2% |
| Range | 24.9% | 31.4% |
| Mean | 13.8% | 12.5% |
| Median | 12.6% | 11.2% |
| Interquartile 25% (IQ1) | 10.6% | 7.9% |
| Interquartile 75% (IQ3) | 17.0% | 16.1% |
| Interquartile Range (IQR) | 6.4% | 8.2% |
| Standard Deviation (Sample) | 5.6% | 6.9% |
| Standard Deviation (Population) | 5.5% | 6.9% |
Similar Demographics by Male Poverty
Demographics Similar to Bangladeshis by Male Poverty
In terms of male poverty, the demographic groups most similar to Bangladeshis are Belizean (13.6%, a difference of 0.10%), Immigrants from Latin America (13.6%, a difference of 0.15%), Haitian (13.7%, a difference of 0.27%), Barbadian (13.6%, a difference of 0.34%), and Mexican (13.7%, a difference of 0.37%).
| Demographics | Rating | Rank | Male Poverty |
| Cree | 0.0 /100 | #270 | Tragic 13.3% |
| Spanish Americans | 0.0 /100 | #271 | Tragic 13.4% |
| Immigrants | Bahamas | 0.0 /100 | #272 | Tragic 13.5% |
| Chickasaw | 0.0 /100 | #273 | Tragic 13.5% |
| Immigrants | West Indies | 0.0 /100 | #274 | Tragic 13.5% |
| Barbadians | 0.0 /100 | #275 | Tragic 13.6% |
| Immigrants | Latin America | 0.0 /100 | #276 | Tragic 13.6% |
| Bangladeshis | 0.0 /100 | #277 | Tragic 13.6% |
| Belizeans | 0.0 /100 | #278 | Tragic 13.6% |
| Haitians | 0.0 /100 | #279 | Tragic 13.7% |
| Mexicans | 0.0 /100 | #280 | Tragic 13.7% |
| Yaqui | 0.0 /100 | #281 | Tragic 13.7% |
| Immigrants | Cabo Verde | 0.0 /100 | #282 | Tragic 13.7% |
| Comanche | 0.0 /100 | #283 | Tragic 13.8% |
| Immigrants | Haiti | 0.0 /100 | #284 | Tragic 13.8% |
Demographics Similar to Malaysians by Male Poverty
In terms of male poverty, the demographic groups most similar to Malaysians are Immigrants from Eastern Africa (12.0%, a difference of 0.10%), Immigrants (12.0%, a difference of 0.33%), Immigrants from the Azores (12.0%, a difference of 0.44%), Panamanian (11.9%, a difference of 0.45%), and Moroccan (12.0%, a difference of 0.50%).
| Demographics | Rating | Rank | Male Poverty |
| Immigrants | Lebanon | 13.6 /100 | #200 | Poor 11.7% |
| Spaniards | 13.5 /100 | #201 | Poor 11.7% |
| Aleuts | 10.4 /100 | #202 | Poor 11.8% |
| Immigrants | Western Asia | 9.8 /100 | #203 | Tragic 11.8% |
| Immigrants | Uganda | 8.5 /100 | #204 | Tragic 11.8% |
| Panamanians | 6.2 /100 | #205 | Tragic 11.9% |
| Immigrants | Eastern Africa | 5.4 /100 | #206 | Tragic 12.0% |
| Malaysians | 5.2 /100 | #207 | Tragic 12.0% |
| Immigrants | Immigrants | 4.5 /100 | #208 | Tragic 12.0% |
| Immigrants | Azores | 4.3 /100 | #209 | Tragic 12.0% |
| Moroccans | 4.2 /100 | #210 | Tragic 12.0% |
| Immigrants | Panama | 4.0 /100 | #211 | Tragic 12.1% |
| Americans | 3.2 /100 | #212 | Tragic 12.1% |
| Immigrants | Nonimmigrants | 3.1 /100 | #213 | Tragic 12.1% |
| Japanese | 2.7 /100 | #214 | Tragic 12.2% |