Navajo vs Immigrants from Northern Africa Male Poverty
COMPARE
Navajo
Immigrants from Northern Africa
Male Poverty
Male Poverty Comparison
Navajo
Immigrants from Northern Africa
22.3%
MALE POVERTY
0.0/ 100
METRIC RATING
346th/ 347
METRIC RANK
11.1%
MALE POVERTY
59.7/ 100
METRIC RATING
161st/ 347
METRIC RANK
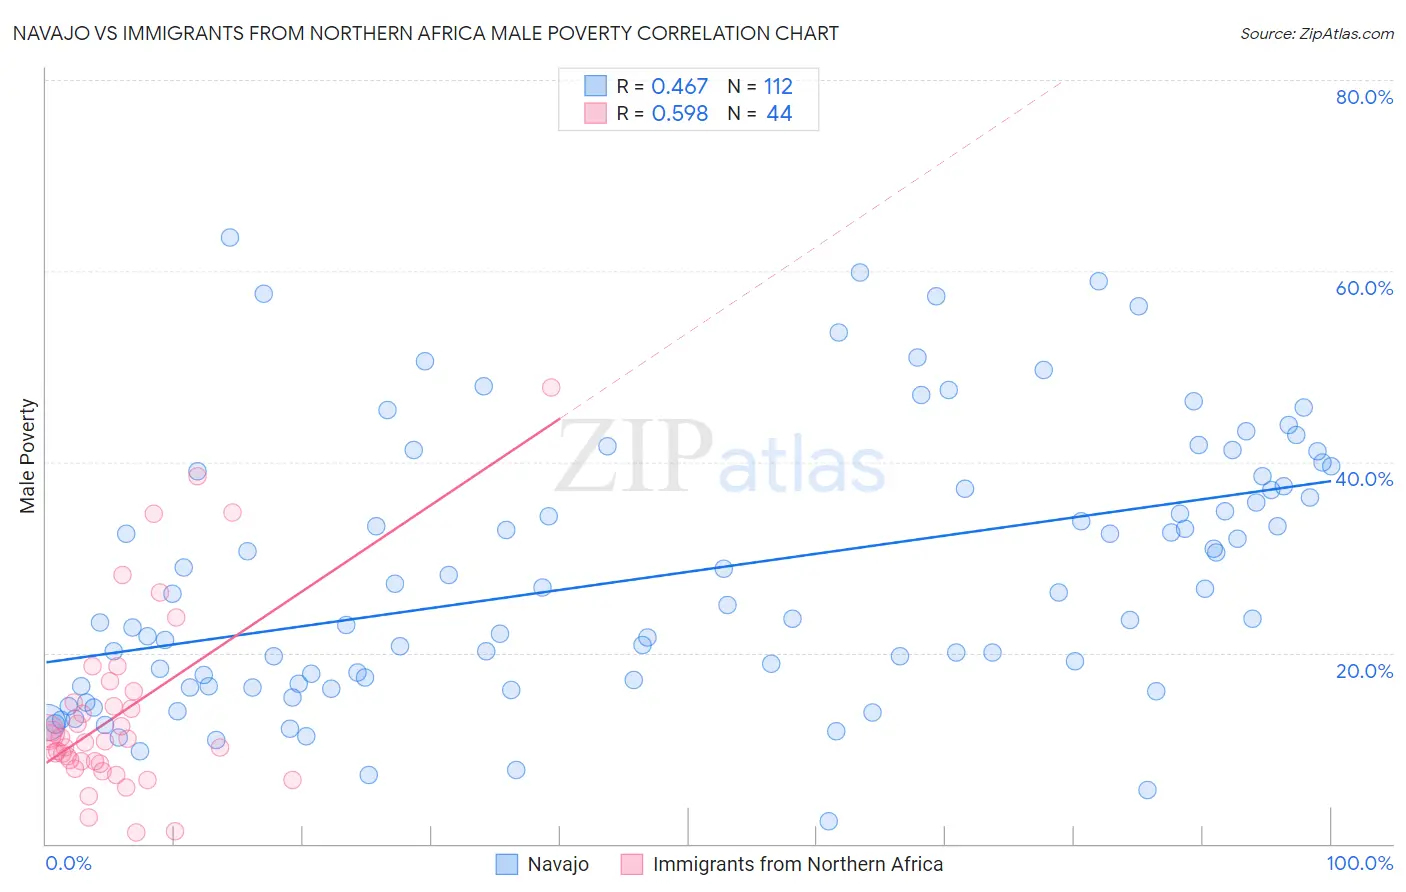
Navajo vs Immigrants from Northern Africa Male Poverty Correlation Chart
The statistical analysis conducted on geographies consisting of 224,713,606 people shows a moderate positive correlation between the proportion of Navajo and poverty level among males in the United States with a correlation coefficient (R) of 0.467 and weighted average of 22.3%. Similarly, the statistical analysis conducted on geographies consisting of 320,989,271 people shows a substantial positive correlation between the proportion of Immigrants from Northern Africa and poverty level among males in the United States with a correlation coefficient (R) of 0.598 and weighted average of 11.1%, a difference of 101.4%.
Male Poverty Correlation Summary
| Measurement | Navajo | Immigrants from Northern Africa |
| Minimum | 2.3% | 1.1% |
| Maximum | 63.5% | 47.8% |
| Range | 61.2% | 46.7% |
| Mean | 28.1% | 13.8% |
| Median | 25.6% | 10.9% |
| Interquartile 25% (IQ1) | 16.6% | 8.5% |
| Interquartile 75% (IQ3) | 38.0% | 15.4% |
| Interquartile Range (IQR) | 21.4% | 6.9% |
| Standard Deviation (Sample) | 13.9% | 9.9% |
| Standard Deviation (Population) | 13.9% | 9.8% |
Similar Demographics by Male Poverty
Demographics Similar to Navajo by Male Poverty
In terms of male poverty, the demographic groups most similar to Navajo are Puerto Rican (22.0%, a difference of 1.3%), Tohono O'odham (22.9%, a difference of 2.6%), Hopi (20.8%, a difference of 7.2%), Yup'ik (20.4%, a difference of 9.4%), and Pima (20.4%, a difference of 9.6%).
| Demographics | Rating | Rank | Male Poverty |
| Natives/Alaskans | 0.0 /100 | #333 | Tragic 16.9% |
| Cheyenne | 0.0 /100 | #334 | Tragic 17.6% |
| Apache | 0.0 /100 | #335 | Tragic 17.7% |
| Pueblo | 0.0 /100 | #336 | Tragic 18.5% |
| Sioux | 0.0 /100 | #337 | Tragic 18.7% |
| Crow | 0.0 /100 | #338 | Tragic 19.1% |
| Yuman | 0.0 /100 | #339 | Tragic 19.5% |
| Immigrants | Yemen | 0.0 /100 | #340 | Tragic 20.1% |
| Lumbee | 0.0 /100 | #341 | Tragic 20.2% |
| Pima | 0.0 /100 | #342 | Tragic 20.4% |
| Yup'ik | 0.0 /100 | #343 | Tragic 20.4% |
| Hopi | 0.0 /100 | #344 | Tragic 20.8% |
| Puerto Ricans | 0.0 /100 | #345 | Tragic 22.0% |
| Navajo | 0.0 /100 | #346 | Tragic 22.3% |
| Tohono O'odham | 0.0 /100 | #347 | Tragic 22.9% |
Demographics Similar to Immigrants from Northern Africa by Male Poverty
In terms of male poverty, the demographic groups most similar to Immigrants from Northern Africa are Soviet Union (11.1%, a difference of 0.070%), Immigrants from Chile (11.1%, a difference of 0.23%), White/Caucasian (11.1%, a difference of 0.30%), Ethiopian (11.1%, a difference of 0.30%), and Taiwanese (11.0%, a difference of 0.32%).
| Demographics | Rating | Rank | Male Poverty |
| Immigrants | Kazakhstan | 64.8 /100 | #154 | Good 11.0% |
| Immigrants | Malaysia | 64.7 /100 | #155 | Good 11.0% |
| Costa Ricans | 63.9 /100 | #156 | Good 11.0% |
| Scotch-Irish | 63.7 /100 | #157 | Good 11.0% |
| Colombians | 63.0 /100 | #158 | Good 11.0% |
| Taiwanese | 62.7 /100 | #159 | Good 11.0% |
| Soviet Union | 60.3 /100 | #160 | Good 11.1% |
| Immigrants | Northern Africa | 59.7 /100 | #161 | Average 11.1% |
| Immigrants | Chile | 57.4 /100 | #162 | Average 11.1% |
| Whites/Caucasians | 56.7 /100 | #163 | Average 11.1% |
| Ethiopians | 56.7 /100 | #164 | Average 11.1% |
| Immigrants | Spain | 55.5 /100 | #165 | Average 11.1% |
| Immigrants | Albania | 55.3 /100 | #166 | Average 11.1% |
| Hungarians | 55.1 /100 | #167 | Average 11.1% |
| Immigrants | Portugal | 54.9 /100 | #168 | Average 11.1% |