Bahamian vs Immigrants from Korea 5th Grade
COMPARE
Bahamian
Immigrants from Korea
5th Grade
5th Grade Comparison
Bahamians
Immigrants from Korea
97.0%
5TH GRADE
5.3/ 100
METRIC RATING
225th/ 347
METRIC RANK
97.3%
5TH GRADE
54.1/ 100
METRIC RATING
169th/ 347
METRIC RANK
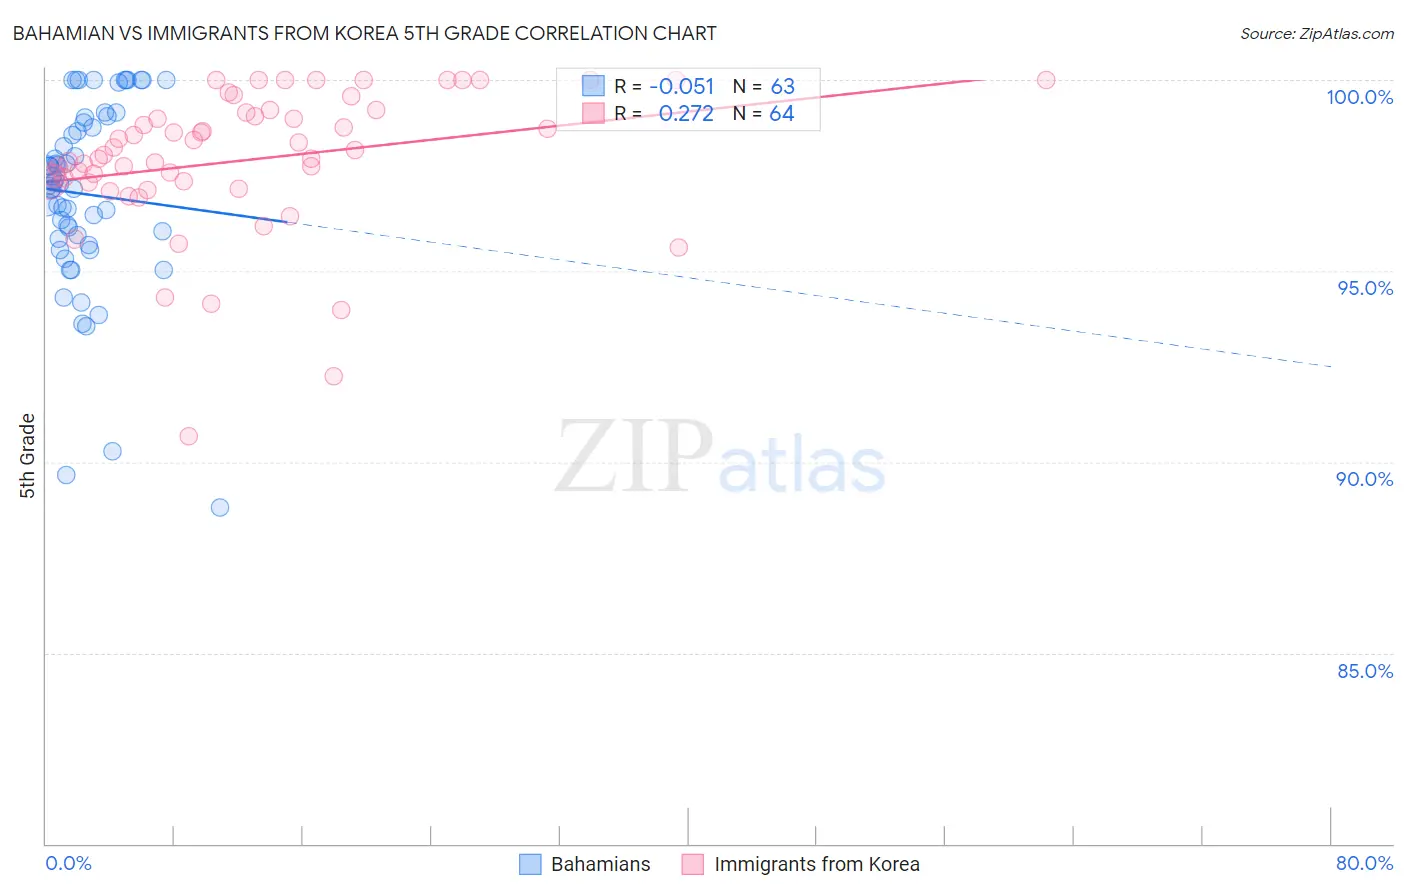
Bahamian vs Immigrants from Korea 5th Grade Correlation Chart
The statistical analysis conducted on geographies consisting of 112,698,819 people shows a slight negative correlation between the proportion of Bahamians and percentage of population with at least 5th grade education in the United States with a correlation coefficient (R) of -0.051 and weighted average of 97.0%. Similarly, the statistical analysis conducted on geographies consisting of 416,280,076 people shows a weak positive correlation between the proportion of Immigrants from Korea and percentage of population with at least 5th grade education in the United States with a correlation coefficient (R) of 0.272 and weighted average of 97.3%, a difference of 0.32%.
5th Grade Correlation Summary
| Measurement | Bahamian | Immigrants from Korea |
| Minimum | 88.8% | 90.7% |
| Maximum | 100.0% | 100.0% |
| Range | 11.2% | 9.3% |
| Mean | 97.0% | 97.9% |
| Median | 97.3% | 98.1% |
| Interquartile 25% (IQ1) | 95.8% | 97.3% |
| Interquartile 75% (IQ3) | 98.9% | 99.2% |
| Interquartile Range (IQR) | 3.1% | 1.8% |
| Standard Deviation (Sample) | 2.5% | 1.9% |
| Standard Deviation (Population) | 2.4% | 1.9% |
Similar Demographics by 5th Grade
Demographics Similar to Bahamians by 5th Grade
In terms of 5th grade, the demographic groups most similar to Bahamians are South American Indian (97.0%, a difference of 0.0%), Tongan (97.0%, a difference of 0.0%), Sierra Leonean (97.1%, a difference of 0.010%), Immigrants from Panama (97.0%, a difference of 0.010%), and Liberian (97.0%, a difference of 0.010%).
| Demographics | Rating | Rank | 5th Grade |
| Immigrants | Sudan | 6.5 /100 | #218 | Tragic 97.1% |
| Immigrants | Syria | 6.4 /100 | #219 | Tragic 97.1% |
| Immigrants | Southern Europe | 6.3 /100 | #220 | Tragic 97.1% |
| Sierra Leoneans | 6.0 /100 | #221 | Tragic 97.1% |
| Immigrants | Panama | 5.7 /100 | #222 | Tragic 97.0% |
| Liberians | 5.7 /100 | #223 | Tragic 97.0% |
| South American Indians | 5.4 /100 | #224 | Tragic 97.0% |
| Bahamians | 5.3 /100 | #225 | Tragic 97.0% |
| Tongans | 5.3 /100 | #226 | Tragic 97.0% |
| Immigrants | Pakistan | 4.7 /100 | #227 | Tragic 97.0% |
| Assyrians/Chaldeans/Syriacs | 4.5 /100 | #228 | Tragic 97.0% |
| Yuman | 4.5 /100 | #229 | Tragic 97.0% |
| Immigrants | Western Asia | 4.3 /100 | #230 | Tragic 97.0% |
| Immigrants | Malaysia | 4.1 /100 | #231 | Tragic 97.0% |
| Immigrants | Eastern Asia | 4.0 /100 | #232 | Tragic 97.0% |
Demographics Similar to Immigrants from Korea by 5th Grade
In terms of 5th grade, the demographic groups most similar to Immigrants from Korea are Immigrants from Belarus (97.3%, a difference of 0.0%), Chilean (97.3%, a difference of 0.0%), Venezuelan (97.3%, a difference of 0.0%), Immigrants from Sri Lanka (97.3%, a difference of 0.0%), and Arab (97.3%, a difference of 0.0%).
| Demographics | Rating | Rank | 5th Grade |
| Immigrants | Iran | 59.5 /100 | #162 | Average 97.4% |
| Ugandans | 58.9 /100 | #163 | Average 97.4% |
| Bermudans | 58.8 /100 | #164 | Average 97.4% |
| Immigrants | Poland | 57.9 /100 | #165 | Average 97.4% |
| Apache | 57.2 /100 | #166 | Average 97.4% |
| Immigrants | Belarus | 54.6 /100 | #167 | Average 97.3% |
| Chileans | 54.5 /100 | #168 | Average 97.3% |
| Immigrants | Korea | 54.1 /100 | #169 | Average 97.3% |
| Venezuelans | 54.0 /100 | #170 | Average 97.3% |
| Immigrants | Sri Lanka | 53.8 /100 | #171 | Average 97.3% |
| Arabs | 53.4 /100 | #172 | Average 97.3% |
| Egyptians | 52.4 /100 | #173 | Average 97.3% |
| Immigrants | Kazakhstan | 50.0 /100 | #174 | Average 97.3% |
| Immigrants | Micronesia | 48.8 /100 | #175 | Average 97.3% |
| Immigrants | Taiwan | 48.4 /100 | #176 | Average 97.3% |