Bahamian vs Immigrants from Korea Currently Married
COMPARE
Bahamian
Immigrants from Korea
Currently Married
Currently Married Comparison
Bahamians
Immigrants from Korea
41.2%
CURRENTLY MARRIED
0.0/ 100
METRIC RATING
318th/ 347
METRIC RANK
49.0%
CURRENTLY MARRIED
99.6/ 100
METRIC RATING
26th/ 347
METRIC RANK
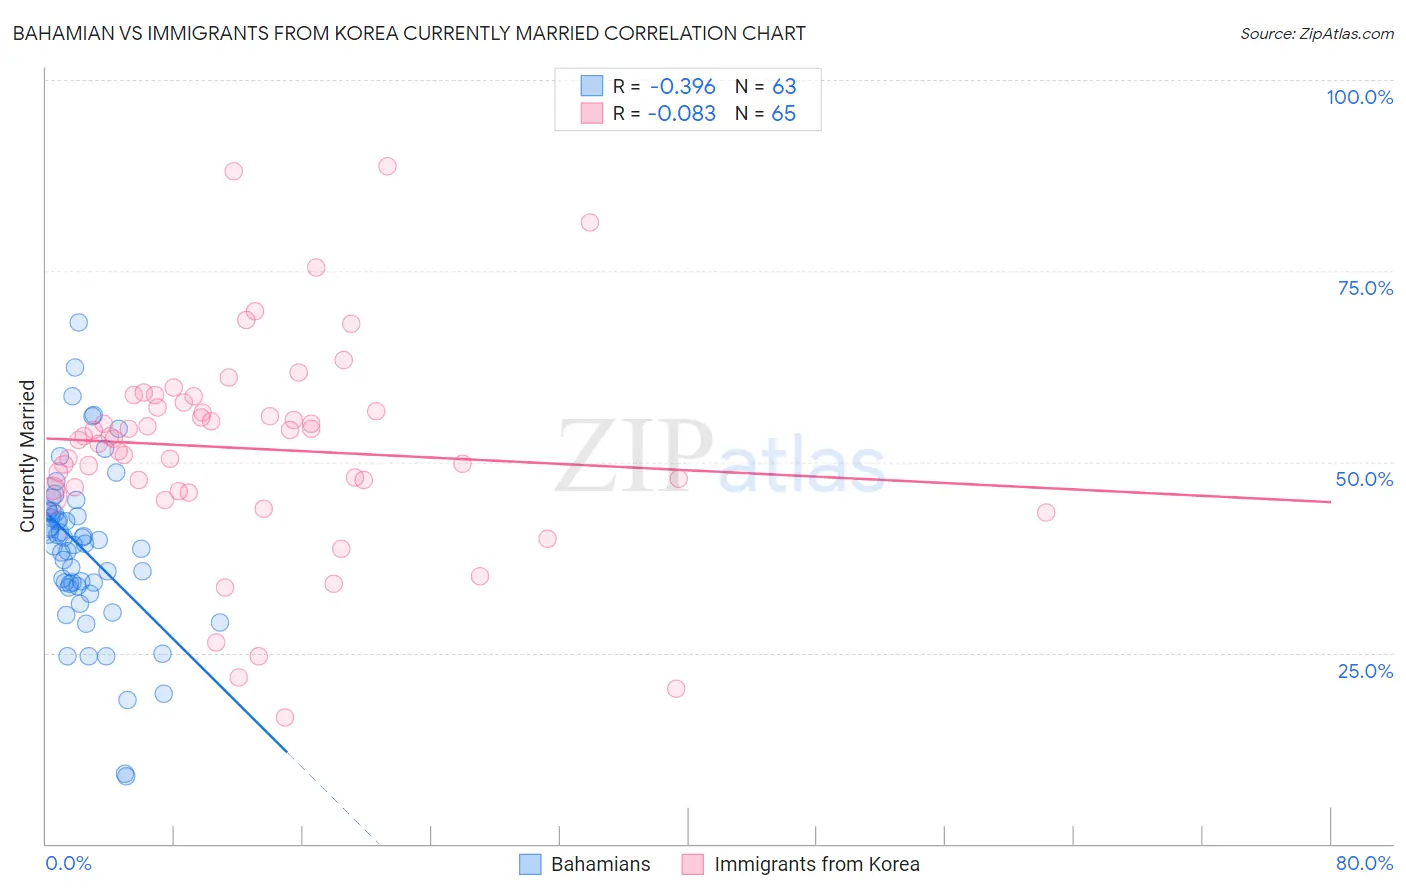
Bahamian vs Immigrants from Korea Currently Married Correlation Chart
The statistical analysis conducted on geographies consisting of 112,687,531 people shows a mild negative correlation between the proportion of Bahamians and percentage of population currently married in the United States with a correlation coefficient (R) of -0.396 and weighted average of 41.2%. Similarly, the statistical analysis conducted on geographies consisting of 416,263,579 people shows a slight negative correlation between the proportion of Immigrants from Korea and percentage of population currently married in the United States with a correlation coefficient (R) of -0.083 and weighted average of 49.0%, a difference of 18.9%.
Currently Married Correlation Summary
| Measurement | Bahamian | Immigrants from Korea |
| Minimum | 8.9% | 16.6% |
| Maximum | 68.3% | 88.7% |
| Range | 59.4% | 72.1% |
| Mean | 38.6% | 51.8% |
| Median | 39.3% | 53.0% |
| Interquartile 25% (IQ1) | 33.7% | 46.4% |
| Interquartile 75% (IQ3) | 43.5% | 57.5% |
| Interquartile Range (IQR) | 9.8% | 11.1% |
| Standard Deviation (Sample) | 10.9% | 13.7% |
| Standard Deviation (Population) | 10.9% | 13.6% |
Similar Demographics by Currently Married
Demographics Similar to Bahamians by Currently Married
In terms of currently married, the demographic groups most similar to Bahamians are Immigrants from Somalia (41.2%, a difference of 0.020%), Immigrants from Jamaica (41.1%, a difference of 0.080%), Haitian (41.3%, a difference of 0.18%), Immigrants from Caribbean (41.3%, a difference of 0.20%), and Inupiat (41.3%, a difference of 0.26%).
| Demographics | Rating | Rank | Currently Married |
| Trinidadians and Tobagonians | 0.0 /100 | #311 | Tragic 41.5% |
| Somalis | 0.0 /100 | #312 | Tragic 41.5% |
| Jamaicans | 0.0 /100 | #313 | Tragic 41.4% |
| West Indians | 0.0 /100 | #314 | Tragic 41.3% |
| Inupiat | 0.0 /100 | #315 | Tragic 41.3% |
| Immigrants | Caribbean | 0.0 /100 | #316 | Tragic 41.3% |
| Haitians | 0.0 /100 | #317 | Tragic 41.3% |
| Bahamians | 0.0 /100 | #318 | Tragic 41.2% |
| Immigrants | Somalia | 0.0 /100 | #319 | Tragic 41.2% |
| Immigrants | Jamaica | 0.0 /100 | #320 | Tragic 41.1% |
| Immigrants | Congo | 0.0 /100 | #321 | Tragic 41.1% |
| Immigrants | Haiti | 0.0 /100 | #322 | Tragic 41.0% |
| Immigrants | West Indies | 0.0 /100 | #323 | Tragic 40.7% |
| Immigrants | Senegal | 0.0 /100 | #324 | Tragic 40.7% |
| U.S. Virgin Islanders | 0.0 /100 | #325 | Tragic 40.7% |
Demographics Similar to Immigrants from Korea by Currently Married
In terms of currently married, the demographic groups most similar to Immigrants from Korea are Maltese (49.0%, a difference of 0.050%), Lithuanian (49.0%, a difference of 0.060%), Burmese (48.9%, a difference of 0.070%), Welsh (48.9%, a difference of 0.11%), and Croatian (48.9%, a difference of 0.15%).
| Demographics | Rating | Rank | Currently Married |
| Europeans | 99.8 /100 | #19 | Exceptional 49.3% |
| Luxembourgers | 99.8 /100 | #20 | Exceptional 49.3% |
| Scottish | 99.8 /100 | #21 | Exceptional 49.2% |
| Bulgarians | 99.7 /100 | #22 | Exceptional 49.1% |
| Immigrants | Pakistan | 99.7 /100 | #23 | Exceptional 49.1% |
| Lithuanians | 99.6 /100 | #24 | Exceptional 49.0% |
| Maltese | 99.6 /100 | #25 | Exceptional 49.0% |
| Immigrants | Korea | 99.6 /100 | #26 | Exceptional 49.0% |
| Burmese | 99.6 /100 | #27 | Exceptional 48.9% |
| Welsh | 99.5 /100 | #28 | Exceptional 48.9% |
| Croatians | 99.5 /100 | #29 | Exceptional 48.9% |
| Eastern Europeans | 99.5 /100 | #30 | Exceptional 48.9% |
| Poles | 99.5 /100 | #31 | Exceptional 48.9% |
| Immigrants | Hong Kong | 99.5 /100 | #32 | Exceptional 48.9% |
| Irish | 99.5 /100 | #33 | Exceptional 48.9% |