Immigrants vs Immigrants from Uganda Female Poverty
COMPARE
Immigrants
Immigrants from Uganda
Female Poverty
Female Poverty Comparison
Immigrants
Immigrants from Uganda
14.4%
FEMALE POVERTY
4.5/ 100
METRIC RATING
217th/ 347
METRIC RANK
13.7%
FEMALE POVERTY
28.5/ 100
METRIC RATING
198th/ 347
METRIC RANK
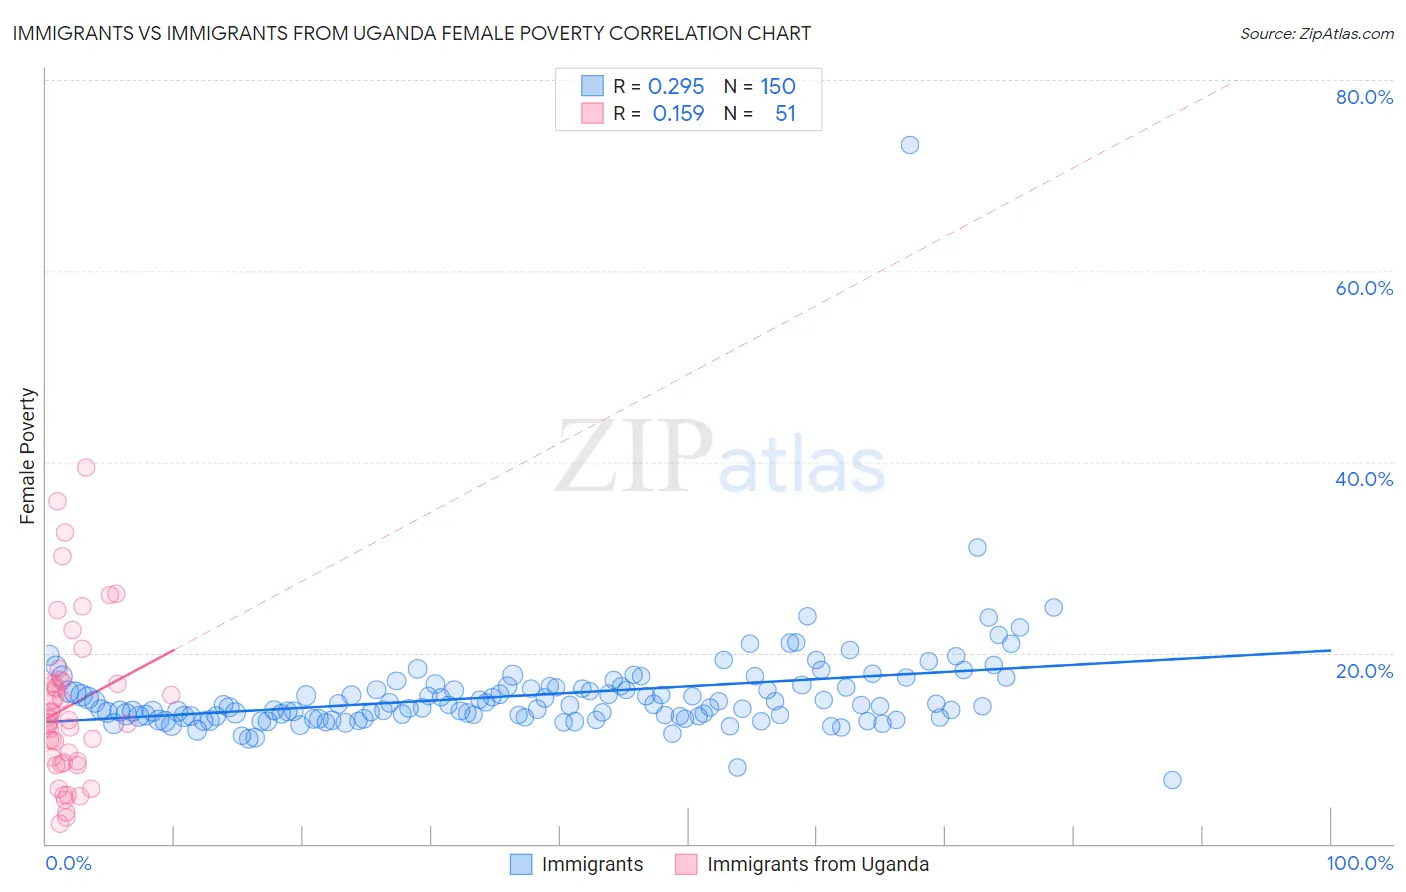
Immigrants vs Immigrants from Uganda Female Poverty Correlation Chart
The statistical analysis conducted on geographies consisting of 576,347,863 people shows a weak positive correlation between the proportion of Immigrants and poverty level among females in the United States with a correlation coefficient (R) of 0.295 and weighted average of 14.4%. Similarly, the statistical analysis conducted on geographies consisting of 125,969,010 people shows a poor positive correlation between the proportion of Immigrants from Uganda and poverty level among females in the United States with a correlation coefficient (R) of 0.159 and weighted average of 13.7%, a difference of 5.0%.
Female Poverty Correlation Summary
| Measurement | Immigrants | Immigrants from Uganda |
| Minimum | 6.7% | 2.1% |
| Maximum | 73.1% | 39.4% |
| Range | 66.5% | 37.3% |
| Mean | 15.6% | 14.4% |
| Median | 14.4% | 12.9% |
| Interquartile 25% (IQ1) | 13.3% | 8.5% |
| Interquartile 75% (IQ3) | 16.4% | 17.0% |
| Interquartile Range (IQR) | 3.1% | 8.5% |
| Standard Deviation (Sample) | 5.6% | 8.4% |
| Standard Deviation (Population) | 5.6% | 8.3% |
Demographics Similar to Immigrants and Immigrants from Uganda by Female Poverty
In terms of female poverty, the demographic groups most similar to Immigrants are Immigrants from Thailand (14.4%, a difference of 0.030%), Immigrants from Panama (14.4%, a difference of 0.12%), Marshallese (14.4%, a difference of 0.27%), Alaskan Athabascan (14.4%, a difference of 0.42%), and Bermudan (14.4%, a difference of 0.51%). Similarly, the demographic groups most similar to Immigrants from Uganda are Arab (13.7%, a difference of 0.010%), Immigrants from Lebanon (13.8%, a difference of 0.34%), Spanish (13.9%, a difference of 0.89%), Immigrants from Kenya (13.9%, a difference of 0.93%), and Hmong (13.9%, a difference of 0.94%).
| Demographics | Rating | Rank | Female Poverty |
| Arabs | 28.6 /100 | #197 | Fair 13.7% |
| Immigrants | Uganda | 28.5 /100 | #198 | Fair 13.7% |
| Immigrants | Lebanon | 25.6 /100 | #199 | Fair 13.8% |
| Spanish | 21.4 /100 | #200 | Fair 13.9% |
| Immigrants | Kenya | 21.1 /100 | #201 | Fair 13.9% |
| Hmong | 21.1 /100 | #202 | Fair 13.9% |
| Immigrants | Western Asia | 20.7 /100 | #203 | Fair 13.9% |
| Spaniards | 18.9 /100 | #204 | Poor 13.9% |
| Ugandans | 15.4 /100 | #205 | Poor 14.0% |
| Immigrants | Uruguay | 14.0 /100 | #206 | Poor 14.0% |
| Immigrants | Eastern Africa | 9.0 /100 | #207 | Tragic 14.2% |
| Immigrants | Azores | 7.9 /100 | #208 | Tragic 14.2% |
| Panamanians | 7.7 /100 | #209 | Tragic 14.2% |
| Malaysians | 7.4 /100 | #210 | Tragic 14.3% |
| Moroccans | 7.2 /100 | #211 | Tragic 14.3% |
| Bermudans | 5.5 /100 | #212 | Tragic 14.4% |
| Alaskan Athabascans | 5.3 /100 | #213 | Tragic 14.4% |
| Marshallese | 5.0 /100 | #214 | Tragic 14.4% |
| Immigrants | Panama | 4.7 /100 | #215 | Tragic 14.4% |
| Immigrants | Thailand | 4.5 /100 | #216 | Tragic 14.4% |
| Immigrants | Immigrants | 4.5 /100 | #217 | Tragic 14.4% |