Austrian vs Immigrants from Peru Receiving Food Stamps
COMPARE
Austrian
Immigrants from Peru
Receiving Food Stamps
Receiving Food Stamps Comparison
Austrians
Immigrants from Peru
10.0%
RECEIVING FOOD STAMPS
98.6/ 100
METRIC RATING
82nd/ 347
METRIC RANK
12.0%
RECEIVING FOOD STAMPS
32.2/ 100
METRIC RATING
190th/ 347
METRIC RANK
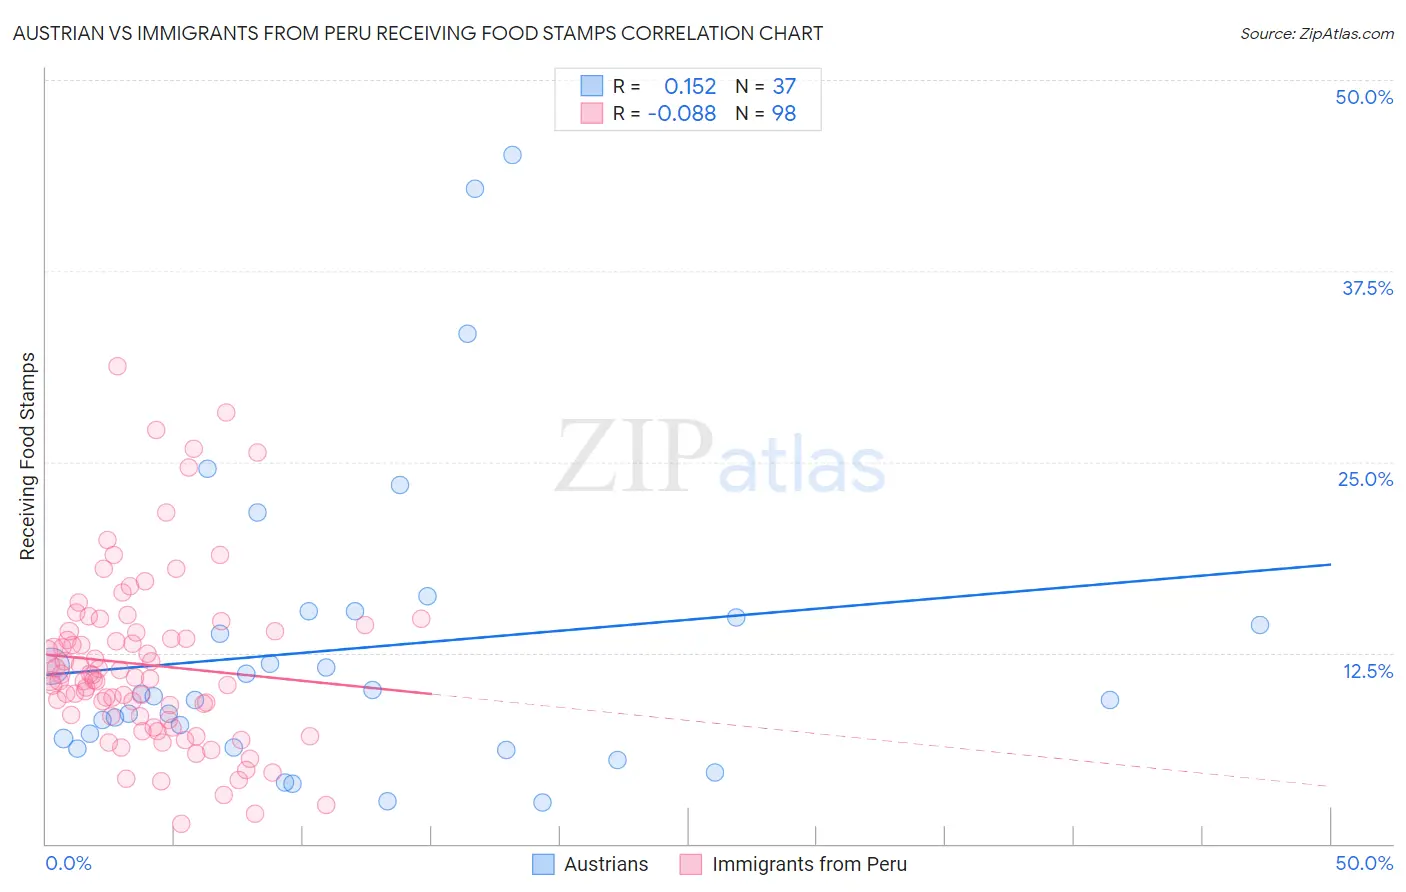
Austrian vs Immigrants from Peru Receiving Food Stamps Correlation Chart
The statistical analysis conducted on geographies consisting of 450,225,937 people shows a poor positive correlation between the proportion of Austrians and percentage of population receiving government assistance and/or food stamps in the United States with a correlation coefficient (R) of 0.152 and weighted average of 10.0%. Similarly, the statistical analysis conducted on geographies consisting of 328,237,841 people shows a slight negative correlation between the proportion of Immigrants from Peru and percentage of population receiving government assistance and/or food stamps in the United States with a correlation coefficient (R) of -0.088 and weighted average of 12.0%, a difference of 20.4%.
Receiving Food Stamps Correlation Summary
| Measurement | Austrian | Immigrants from Peru |
| Minimum | 2.7% | 1.3% |
| Maximum | 45.1% | 31.3% |
| Range | 42.4% | 30.0% |
| Mean | 12.8% | 11.7% |
| Median | 9.7% | 10.8% |
| Interquartile 25% (IQ1) | 6.6% | 8.3% |
| Interquartile 75% (IQ3) | 15.0% | 13.9% |
| Interquartile Range (IQR) | 8.4% | 5.6% |
| Standard Deviation (Sample) | 10.0% | 5.6% |
| Standard Deviation (Population) | 9.8% | 5.6% |
Similar Demographics by Receiving Food Stamps
Demographics Similar to Austrians by Receiving Food Stamps
In terms of receiving food stamps, the demographic groups most similar to Austrians are Dutch (10.0%, a difference of 0.0%), Immigrants from Israel (10.0%, a difference of 0.070%), Immigrants from England (10.0%, a difference of 0.13%), Immigrants from Romania (10.0%, a difference of 0.25%), and Polish (10.0%, a difference of 0.27%).
| Demographics | Rating | Rank | Receiving Food Stamps |
| Immigrants | Zimbabwe | 98.7 /100 | #75 | Exceptional 9.9% |
| Immigrants | Croatia | 98.7 /100 | #76 | Exceptional 10.0% |
| Immigrants | North Macedonia | 98.7 /100 | #77 | Exceptional 10.0% |
| South Africans | 98.7 /100 | #78 | Exceptional 10.0% |
| Laotians | 98.7 /100 | #79 | Exceptional 10.0% |
| Poles | 98.6 /100 | #80 | Exceptional 10.0% |
| Immigrants | England | 98.6 /100 | #81 | Exceptional 10.0% |
| Austrians | 98.6 /100 | #82 | Exceptional 10.0% |
| Dutch | 98.6 /100 | #83 | Exceptional 10.0% |
| Immigrants | Israel | 98.5 /100 | #84 | Exceptional 10.0% |
| Immigrants | Romania | 98.5 /100 | #85 | Exceptional 10.0% |
| Immigrants | Norway | 98.4 /100 | #86 | Exceptional 10.0% |
| Egyptians | 98.4 /100 | #87 | Exceptional 10.0% |
| Immigrants | Kuwait | 98.4 /100 | #88 | Exceptional 10.0% |
| Immigrants | France | 98.3 /100 | #89 | Exceptional 10.1% |
Demographics Similar to Immigrants from Peru by Receiving Food Stamps
In terms of receiving food stamps, the demographic groups most similar to Immigrants from Peru are Venezuelan (12.0%, a difference of 0.010%), Immigrants from Cameroon (12.0%, a difference of 0.060%), Samoan (12.1%, a difference of 0.19%), Sudanese (12.0%, a difference of 0.20%), and Albanian (12.0%, a difference of 0.50%).
| Demographics | Rating | Rank | Receiving Food Stamps |
| Immigrants | Uganda | 40.3 /100 | #183 | Average 11.9% |
| Spaniards | 39.8 /100 | #184 | Fair 11.9% |
| Immigrants | Iraq | 37.1 /100 | #185 | Fair 12.0% |
| Spanish | 36.9 /100 | #186 | Fair 12.0% |
| Albanians | 35.4 /100 | #187 | Fair 12.0% |
| Sudanese | 33.4 /100 | #188 | Fair 12.0% |
| Immigrants | Cameroon | 32.5 /100 | #189 | Fair 12.0% |
| Immigrants | Peru | 32.2 /100 | #190 | Fair 12.0% |
| Venezuelans | 32.1 /100 | #191 | Fair 12.0% |
| Samoans | 31.0 /100 | #192 | Fair 12.1% |
| Immigrants | Fiji | 27.8 /100 | #193 | Fair 12.1% |
| Immigrants | Sudan | 27.1 /100 | #194 | Fair 12.1% |
| Americans | 26.7 /100 | #195 | Fair 12.2% |
| Iraqis | 26.6 /100 | #196 | Fair 12.2% |
| Delaware | 26.1 /100 | #197 | Fair 12.2% |