Austrian vs Estonian Receiving Food Stamps
COMPARE
Austrian
Estonian
Receiving Food Stamps
Receiving Food Stamps Comparison
Austrians
Estonians
10.0%
RECEIVING FOOD STAMPS
98.6/ 100
METRIC RATING
82nd/ 347
METRIC RANK
9.5%
RECEIVING FOOD STAMPS
99.6/ 100
METRIC RATING
36th/ 347
METRIC RANK
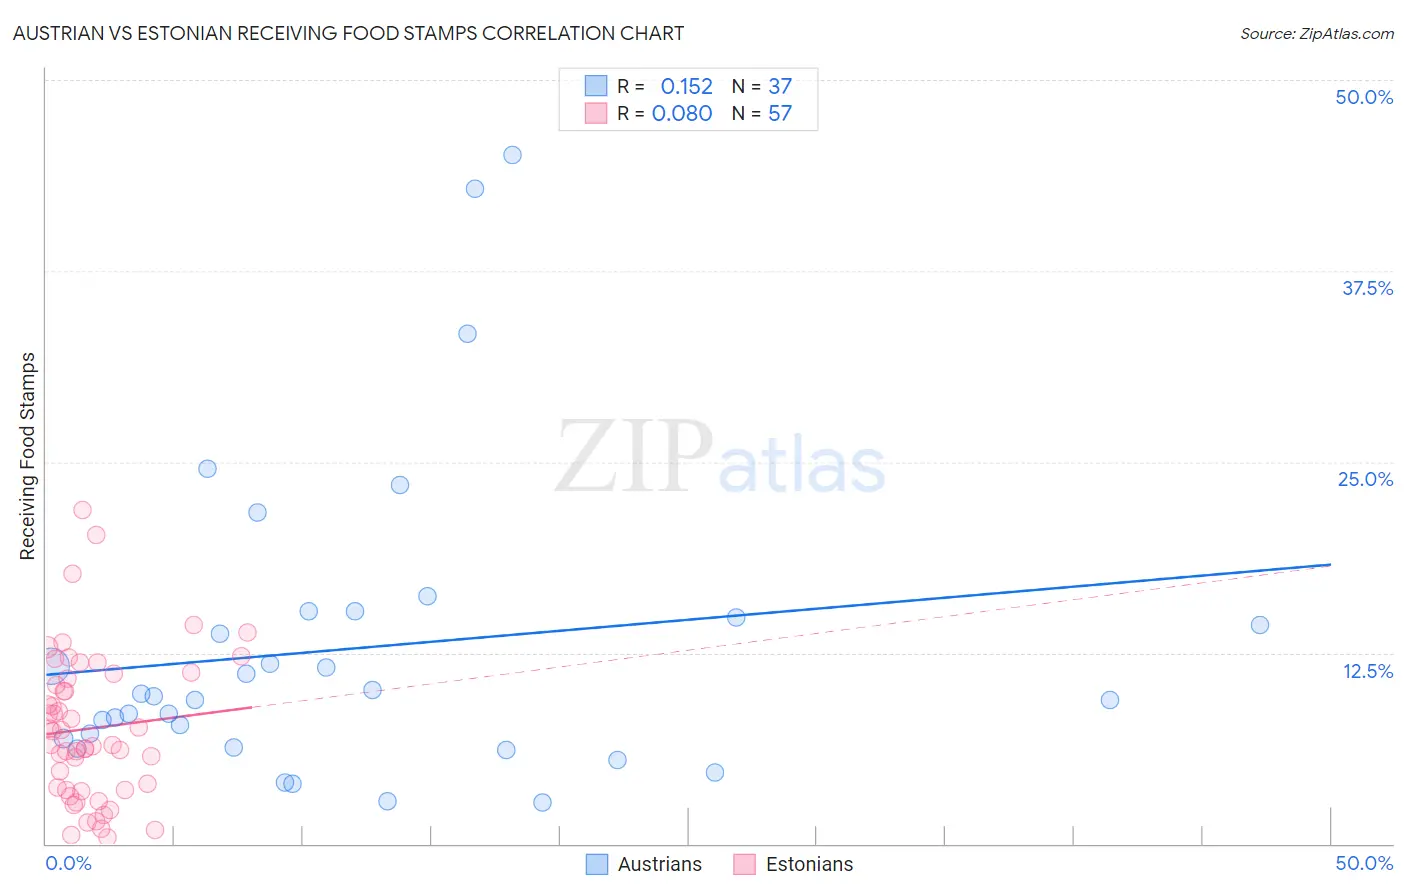
Austrian vs Estonian Receiving Food Stamps Correlation Chart
The statistical analysis conducted on geographies consisting of 450,225,937 people shows a poor positive correlation between the proportion of Austrians and percentage of population receiving government assistance and/or food stamps in the United States with a correlation coefficient (R) of 0.152 and weighted average of 10.0%. Similarly, the statistical analysis conducted on geographies consisting of 123,351,166 people shows a slight positive correlation between the proportion of Estonians and percentage of population receiving government assistance and/or food stamps in the United States with a correlation coefficient (R) of 0.080 and weighted average of 9.5%, a difference of 5.4%.
Receiving Food Stamps Correlation Summary
| Measurement | Austrian | Estonian |
| Minimum | 2.7% | 0.40% |
| Maximum | 45.1% | 21.8% |
| Range | 42.4% | 21.4% |
| Mean | 12.8% | 7.6% |
| Median | 9.7% | 6.5% |
| Interquartile 25% (IQ1) | 6.6% | 3.5% |
| Interquartile 75% (IQ3) | 15.0% | 10.9% |
| Interquartile Range (IQR) | 8.4% | 7.4% |
| Standard Deviation (Sample) | 10.0% | 4.8% |
| Standard Deviation (Population) | 9.8% | 4.8% |
Similar Demographics by Receiving Food Stamps
Demographics Similar to Austrians by Receiving Food Stamps
In terms of receiving food stamps, the demographic groups most similar to Austrians are Dutch (10.0%, a difference of 0.0%), Immigrants from Israel (10.0%, a difference of 0.070%), Immigrants from England (10.0%, a difference of 0.13%), Immigrants from Romania (10.0%, a difference of 0.25%), and Polish (10.0%, a difference of 0.27%).
| Demographics | Rating | Rank | Receiving Food Stamps |
| Immigrants | Zimbabwe | 98.7 /100 | #75 | Exceptional 9.9% |
| Immigrants | Croatia | 98.7 /100 | #76 | Exceptional 10.0% |
| Immigrants | North Macedonia | 98.7 /100 | #77 | Exceptional 10.0% |
| South Africans | 98.7 /100 | #78 | Exceptional 10.0% |
| Laotians | 98.7 /100 | #79 | Exceptional 10.0% |
| Poles | 98.6 /100 | #80 | Exceptional 10.0% |
| Immigrants | England | 98.6 /100 | #81 | Exceptional 10.0% |
| Austrians | 98.6 /100 | #82 | Exceptional 10.0% |
| Dutch | 98.6 /100 | #83 | Exceptional 10.0% |
| Immigrants | Israel | 98.5 /100 | #84 | Exceptional 10.0% |
| Immigrants | Romania | 98.5 /100 | #85 | Exceptional 10.0% |
| Immigrants | Norway | 98.4 /100 | #86 | Exceptional 10.0% |
| Egyptians | 98.4 /100 | #87 | Exceptional 10.0% |
| Immigrants | Kuwait | 98.4 /100 | #88 | Exceptional 10.0% |
| Immigrants | France | 98.3 /100 | #89 | Exceptional 10.1% |
Demographics Similar to Estonians by Receiving Food Stamps
In terms of receiving food stamps, the demographic groups most similar to Estonians are Immigrants from Austria (9.5%, a difference of 0.020%), Turkish (9.5%, a difference of 0.050%), Zimbabwean (9.5%, a difference of 0.070%), European (9.5%, a difference of 0.070%), and Immigrants from Sri Lanka (9.5%, a difference of 0.36%).
| Demographics | Rating | Rank | Receiving Food Stamps |
| Immigrants | Lithuania | 99.8 /100 | #29 | Exceptional 9.2% |
| Immigrants | Sweden | 99.7 /100 | #30 | Exceptional 9.3% |
| Immigrants | Eastern Asia | 99.7 /100 | #31 | Exceptional 9.3% |
| Bolivians | 99.7 /100 | #32 | Exceptional 9.3% |
| Zimbabweans | 99.6 /100 | #33 | Exceptional 9.5% |
| Turks | 99.6 /100 | #34 | Exceptional 9.5% |
| Immigrants | Austria | 99.6 /100 | #35 | Exceptional 9.5% |
| Estonians | 99.6 /100 | #36 | Exceptional 9.5% |
| Europeans | 99.6 /100 | #37 | Exceptional 9.5% |
| Immigrants | Sri Lanka | 99.5 /100 | #38 | Exceptional 9.5% |
| Immigrants | Bolivia | 99.5 /100 | #39 | Exceptional 9.5% |
| Immigrants | Netherlands | 99.5 /100 | #40 | Exceptional 9.5% |
| Cambodians | 99.5 /100 | #41 | Exceptional 9.5% |
| Immigrants | China | 99.5 /100 | #42 | Exceptional 9.6% |
| Croatians | 99.5 /100 | #43 | Exceptional 9.6% |