Austrian vs Immigrants from Peru Seniors Poverty Over the Age of 65
COMPARE
Austrian
Immigrants from Peru
Seniors Poverty Over the Age of 65
Seniors Poverty Over the Age of 65 Comparison
Austrians
Immigrants from Peru
9.6%
SENIORS POVERTY OVER THE AGE OF 65
99.5/ 100
METRIC RATING
44th/ 347
METRIC RANK
12.0%
SENIORS POVERTY OVER THE AGE OF 65
1.3/ 100
METRIC RATING
236th/ 347
METRIC RANK
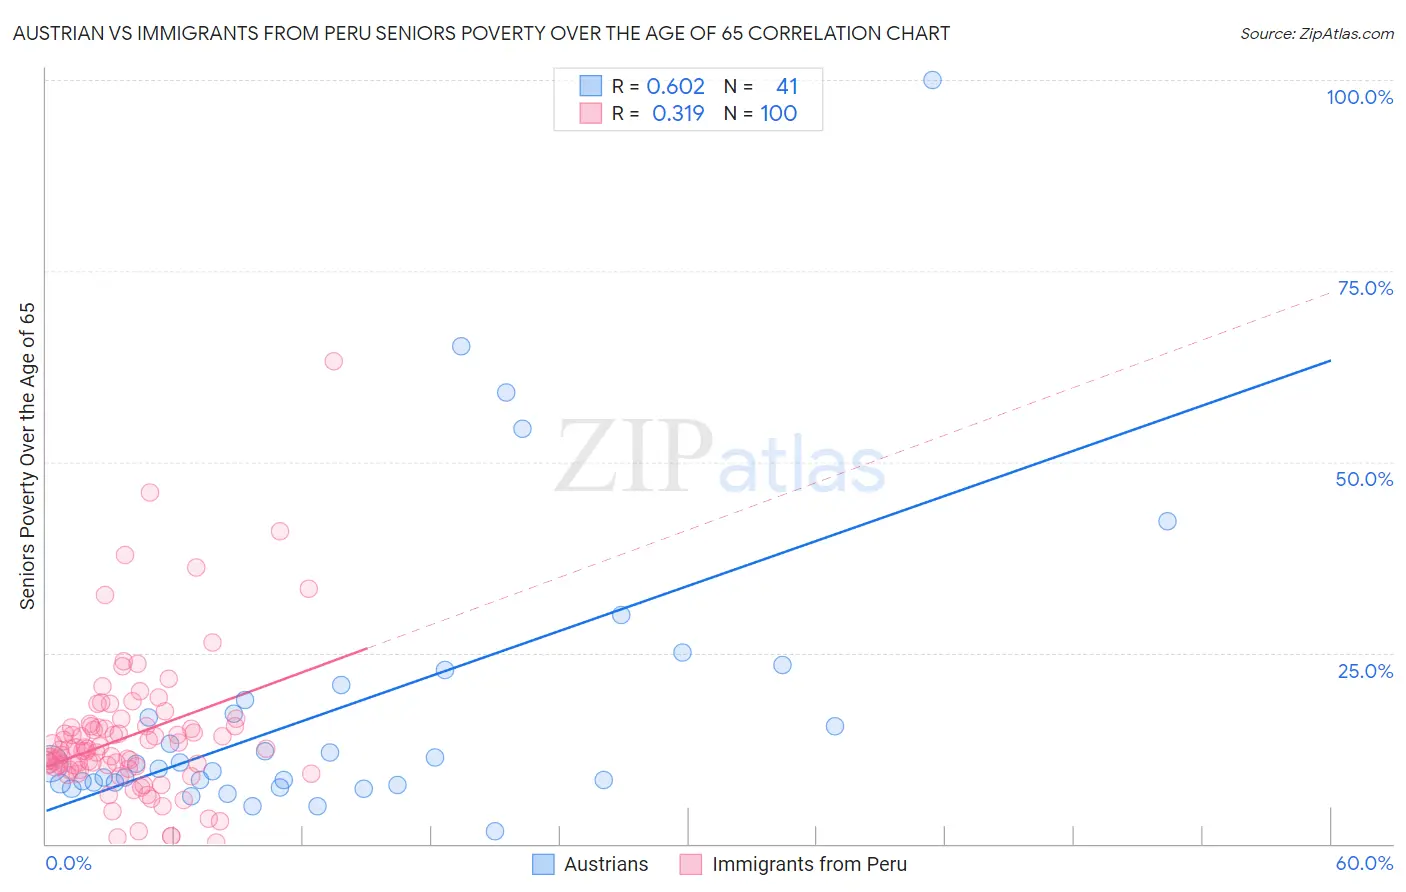
Austrian vs Immigrants from Peru Seniors Poverty Over the Age of 65 Correlation Chart
The statistical analysis conducted on geographies consisting of 450,094,834 people shows a significant positive correlation between the proportion of Austrians and poverty level among seniors over the age of 65 in the United States with a correlation coefficient (R) of 0.602 and weighted average of 9.6%. Similarly, the statistical analysis conducted on geographies consisting of 328,128,763 people shows a mild positive correlation between the proportion of Immigrants from Peru and poverty level among seniors over the age of 65 in the United States with a correlation coefficient (R) of 0.319 and weighted average of 12.0%, a difference of 24.4%.
Seniors Poverty Over the Age of 65 Correlation Summary
| Measurement | Austrian | Immigrants from Peru |
| Minimum | 1.6% | 0.12% |
| Maximum | 100.0% | 63.2% |
| Range | 98.4% | 63.0% |
| Mean | 18.0% | 14.1% |
| Median | 10.5% | 12.4% |
| Interquartile 25% (IQ1) | 7.9% | 10.0% |
| Interquartile 75% (IQ3) | 19.8% | 15.4% |
| Interquartile Range (IQR) | 11.8% | 5.4% |
| Standard Deviation (Sample) | 19.7% | 9.4% |
| Standard Deviation (Population) | 19.4% | 9.4% |
Similar Demographics by Seniors Poverty Over the Age of 65
Demographics Similar to Austrians by Seniors Poverty Over the Age of 65
In terms of seniors poverty over the age of 65, the demographic groups most similar to Austrians are Eastern European (9.6%, a difference of 0.10%), Estonian (9.6%, a difference of 0.18%), Zimbabwean (9.6%, a difference of 0.20%), Immigrants from Taiwan (9.7%, a difference of 0.32%), and Immigrants from South Central Asia (9.7%, a difference of 0.33%).
| Demographics | Rating | Rank | Seniors Poverty Over the Age of 65 |
| Scotch-Irish | 99.7 /100 | #37 | Exceptional 9.5% |
| Belgians | 99.7 /100 | #38 | Exceptional 9.5% |
| Greeks | 99.6 /100 | #39 | Exceptional 9.6% |
| Assyrians/Chaldeans/Syriacs | 99.6 /100 | #40 | Exceptional 9.6% |
| Immigrants | North Macedonia | 99.6 /100 | #41 | Exceptional 9.6% |
| Zimbabweans | 99.6 /100 | #42 | Exceptional 9.6% |
| Eastern Europeans | 99.6 /100 | #43 | Exceptional 9.6% |
| Austrians | 99.5 /100 | #44 | Exceptional 9.6% |
| Estonians | 99.5 /100 | #45 | Exceptional 9.6% |
| Immigrants | Taiwan | 99.5 /100 | #46 | Exceptional 9.7% |
| Immigrants | South Central Asia | 99.5 /100 | #47 | Exceptional 9.7% |
| French | 99.5 /100 | #48 | Exceptional 9.7% |
| Immigrants | Lithuania | 99.4 /100 | #49 | Exceptional 9.7% |
| Hungarians | 99.4 /100 | #50 | Exceptional 9.7% |
| Carpatho Rusyns | 99.3 /100 | #51 | Exceptional 9.7% |
Demographics Similar to Immigrants from Peru by Seniors Poverty Over the Age of 65
In terms of seniors poverty over the age of 65, the demographic groups most similar to Immigrants from Peru are Immigrants from Argentina (12.0%, a difference of 0.030%), Moroccan (12.0%, a difference of 0.15%), Seminole (12.0%, a difference of 0.37%), Iroquois (11.9%, a difference of 0.53%), and Panamanian (11.9%, a difference of 0.63%).
| Demographics | Rating | Rank | Seniors Poverty Over the Age of 65 |
| Immigrants | Eritrea | 2.6 /100 | #229 | Tragic 11.8% |
| Bermudans | 2.1 /100 | #230 | Tragic 11.9% |
| Cajuns | 2.0 /100 | #231 | Tragic 11.9% |
| Yaqui | 1.9 /100 | #232 | Tragic 11.9% |
| Panamanians | 1.8 /100 | #233 | Tragic 11.9% |
| Iroquois | 1.7 /100 | #234 | Tragic 11.9% |
| Immigrants | Argentina | 1.3 /100 | #235 | Tragic 12.0% |
| Immigrants | Peru | 1.3 /100 | #236 | Tragic 12.0% |
| Moroccans | 1.2 /100 | #237 | Tragic 12.0% |
| Seminole | 1.1 /100 | #238 | Tragic 12.0% |
| Immigrants | Spain | 1.0 /100 | #239 | Tragic 12.1% |
| Comanche | 0.9 /100 | #240 | Tragic 12.1% |
| Immigrants | Albania | 0.9 /100 | #241 | Tragic 12.1% |
| Sub-Saharan Africans | 0.9 /100 | #242 | Tragic 12.1% |
| Uruguayans | 0.8 /100 | #243 | Tragic 12.1% |