Austrian vs Immigrants from Peru Disability
COMPARE
Austrian
Immigrants from Peru
Disability
Disability Comparison
Austrians
Immigrants from Peru
12.0%
DISABILITY
7.2/ 100
METRIC RATING
212th/ 347
METRIC RANK
10.8%
DISABILITY
99.9/ 100
METRIC RATING
45th/ 347
METRIC RANK
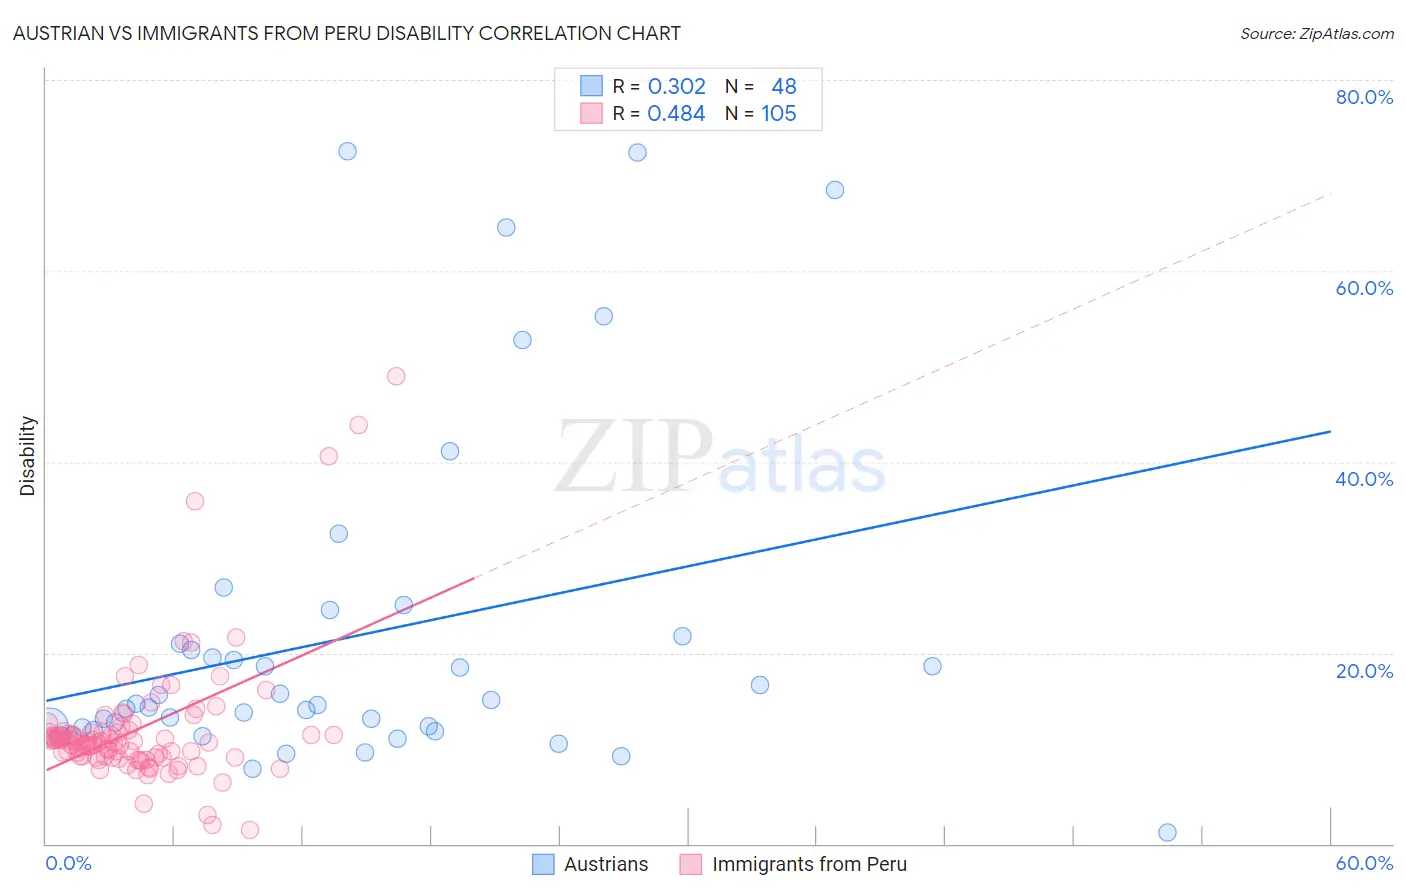
Austrian vs Immigrants from Peru Disability Correlation Chart
The statistical analysis conducted on geographies consisting of 452,057,102 people shows a mild positive correlation between the proportion of Austrians and percentage of population with a disability in the United States with a correlation coefficient (R) of 0.302 and weighted average of 12.0%. Similarly, the statistical analysis conducted on geographies consisting of 328,839,266 people shows a moderate positive correlation between the proportion of Immigrants from Peru and percentage of population with a disability in the United States with a correlation coefficient (R) of 0.484 and weighted average of 10.8%, a difference of 11.1%.
Disability Correlation Summary
| Measurement | Austrian | Immigrants from Peru |
| Minimum | 1.2% | 1.4% |
| Maximum | 72.5% | 49.0% |
| Range | 71.4% | 47.6% |
| Mean | 21.8% | 12.0% |
| Median | 14.6% | 10.7% |
| Interquartile 25% (IQ1) | 12.1% | 9.1% |
| Interquartile 75% (IQ3) | 21.4% | 11.7% |
| Interquartile Range (IQR) | 9.3% | 2.6% |
| Standard Deviation (Sample) | 17.7% | 7.0% |
| Standard Deviation (Population) | 17.5% | 6.9% |
Similar Demographics by Disability
Demographics Similar to Austrians by Disability
In terms of disability, the demographic groups most similar to Austrians are Immigrants from Iraq (12.0%, a difference of 0.010%), Immigrants from Cambodia (12.0%, a difference of 0.030%), Immigrants from Somalia (12.0%, a difference of 0.060%), Czech (12.0%, a difference of 0.11%), and Immigrants from Canada (12.1%, a difference of 0.18%).
| Demographics | Rating | Rank | Disability |
| Immigrants | Western Europe | 10.1 /100 | #205 | Poor 12.0% |
| Immigrants | Senegal | 9.4 /100 | #206 | Tragic 12.0% |
| Immigrants | Thailand | 9.3 /100 | #207 | Tragic 12.0% |
| Immigrants | Caribbean | 9.1 /100 | #208 | Tragic 12.0% |
| Danes | 8.7 /100 | #209 | Tragic 12.0% |
| Czechs | 7.9 /100 | #210 | Tragic 12.0% |
| Immigrants | Cambodia | 7.3 /100 | #211 | Tragic 12.0% |
| Austrians | 7.2 /100 | #212 | Tragic 12.0% |
| Immigrants | Iraq | 7.1 /100 | #213 | Tragic 12.0% |
| Immigrants | Somalia | 6.8 /100 | #214 | Tragic 12.0% |
| Immigrants | Canada | 6.1 /100 | #215 | Tragic 12.1% |
| Panamanians | 5.4 /100 | #216 | Tragic 12.1% |
| Immigrants | North America | 5.3 /100 | #217 | Tragic 12.1% |
| Immigrants | Jamaica | 5.0 /100 | #218 | Tragic 12.1% |
| Croatians | 4.9 /100 | #219 | Tragic 12.1% |
Demographics Similar to Immigrants from Peru by Disability
In terms of disability, the demographic groups most similar to Immigrants from Peru are Tongan (10.8%, a difference of 0.010%), Taiwanese (10.8%, a difference of 0.020%), Soviet Union (10.9%, a difference of 0.21%), Vietnamese (10.9%, a difference of 0.27%), and Immigrants from Saudi Arabia (10.9%, a difference of 0.27%).
| Demographics | Rating | Rank | Disability |
| Afghans | 99.9 /100 | #38 | Exceptional 10.8% |
| Cambodians | 99.9 /100 | #39 | Exceptional 10.8% |
| Mongolians | 99.9 /100 | #40 | Exceptional 10.8% |
| Immigrants | Australia | 99.9 /100 | #41 | Exceptional 10.8% |
| Immigrants | Nepal | 99.9 /100 | #42 | Exceptional 10.8% |
| Israelis | 99.9 /100 | #43 | Exceptional 10.8% |
| Immigrants | Japan | 99.9 /100 | #44 | Exceptional 10.8% |
| Immigrants | Peru | 99.9 /100 | #45 | Exceptional 10.8% |
| Tongans | 99.9 /100 | #46 | Exceptional 10.8% |
| Taiwanese | 99.9 /100 | #47 | Exceptional 10.8% |
| Soviet Union | 99.9 /100 | #48 | Exceptional 10.9% |
| Vietnamese | 99.9 /100 | #49 | Exceptional 10.9% |
| Immigrants | Saudi Arabia | 99.9 /100 | #50 | Exceptional 10.9% |
| Peruvians | 99.8 /100 | #51 | Exceptional 10.9% |
| South Americans | 99.8 /100 | #52 | Exceptional 10.9% |