Austrian vs Spanish American Indian Receiving Food Stamps
COMPARE
Austrian
Spanish American Indian
Receiving Food Stamps
Receiving Food Stamps Comparison
Austrians
Spanish American Indians
10.0%
RECEIVING FOOD STAMPS
98.6/ 100
METRIC RATING
82nd/ 347
METRIC RANK
14.9%
RECEIVING FOOD STAMPS
0.0/ 100
METRIC RATING
281st/ 347
METRIC RANK
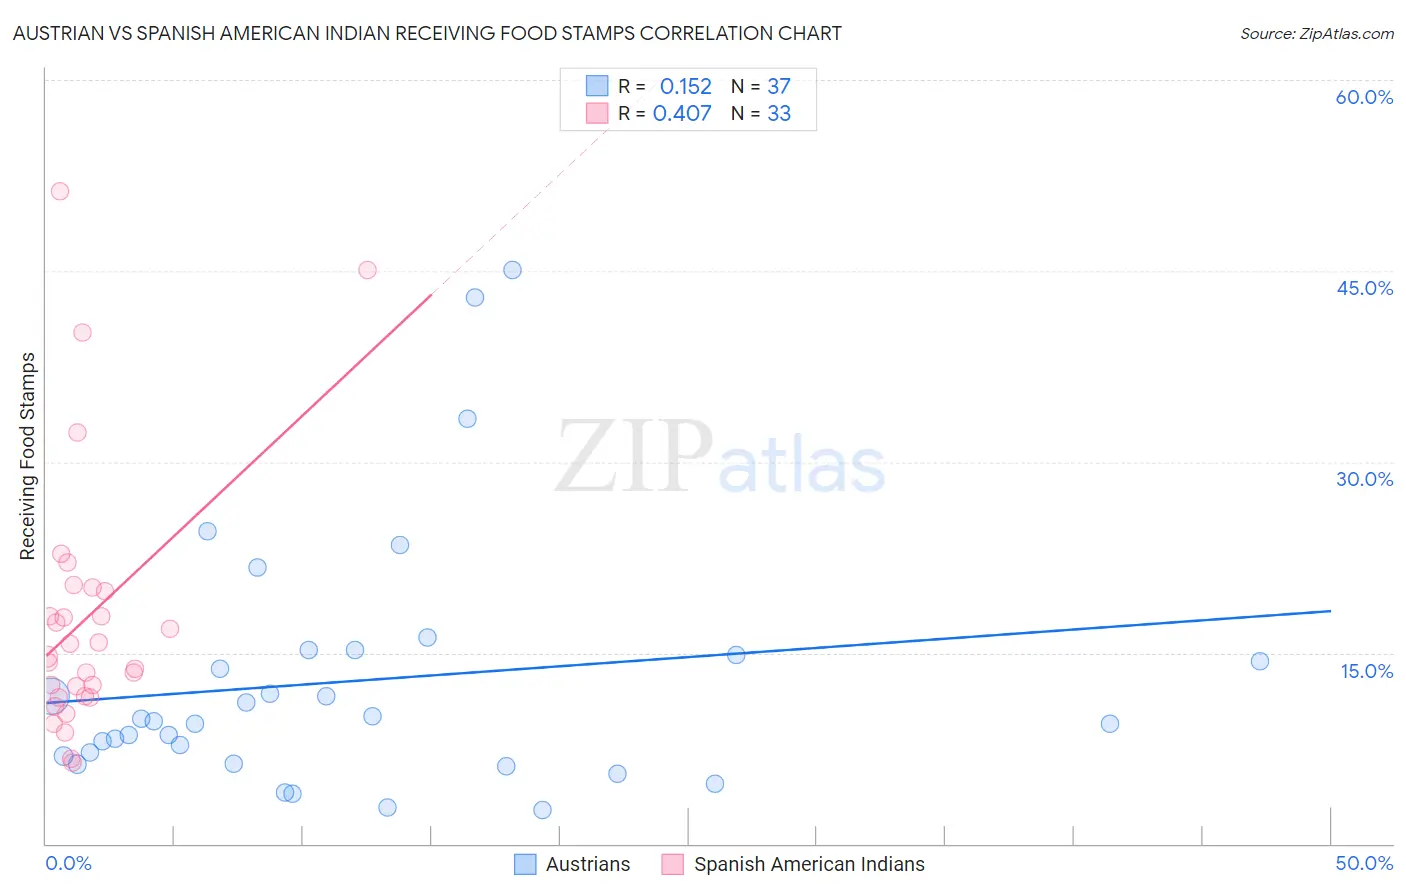
Austrian vs Spanish American Indian Receiving Food Stamps Correlation Chart
The statistical analysis conducted on geographies consisting of 450,225,937 people shows a poor positive correlation between the proportion of Austrians and percentage of population receiving government assistance and/or food stamps in the United States with a correlation coefficient (R) of 0.152 and weighted average of 10.0%. Similarly, the statistical analysis conducted on geographies consisting of 73,107,965 people shows a moderate positive correlation between the proportion of Spanish American Indians and percentage of population receiving government assistance and/or food stamps in the United States with a correlation coefficient (R) of 0.407 and weighted average of 14.9%, a difference of 49.2%.
Receiving Food Stamps Correlation Summary
| Measurement | Austrian | Spanish American Indian |
| Minimum | 2.7% | 6.4% |
| Maximum | 45.1% | 51.3% |
| Range | 42.4% | 44.9% |
| Mean | 12.8% | 17.8% |
| Median | 9.7% | 14.7% |
| Interquartile 25% (IQ1) | 6.6% | 11.5% |
| Interquartile 75% (IQ3) | 15.0% | 20.0% |
| Interquartile Range (IQR) | 8.4% | 8.5% |
| Standard Deviation (Sample) | 10.0% | 10.4% |
| Standard Deviation (Population) | 9.8% | 10.2% |
Similar Demographics by Receiving Food Stamps
Demographics Similar to Austrians by Receiving Food Stamps
In terms of receiving food stamps, the demographic groups most similar to Austrians are Dutch (10.0%, a difference of 0.0%), Immigrants from Israel (10.0%, a difference of 0.070%), Immigrants from England (10.0%, a difference of 0.13%), Immigrants from Romania (10.0%, a difference of 0.25%), and Polish (10.0%, a difference of 0.27%).
| Demographics | Rating | Rank | Receiving Food Stamps |
| Immigrants | Zimbabwe | 98.7 /100 | #75 | Exceptional 9.9% |
| Immigrants | Croatia | 98.7 /100 | #76 | Exceptional 10.0% |
| Immigrants | North Macedonia | 98.7 /100 | #77 | Exceptional 10.0% |
| South Africans | 98.7 /100 | #78 | Exceptional 10.0% |
| Laotians | 98.7 /100 | #79 | Exceptional 10.0% |
| Poles | 98.6 /100 | #80 | Exceptional 10.0% |
| Immigrants | England | 98.6 /100 | #81 | Exceptional 10.0% |
| Austrians | 98.6 /100 | #82 | Exceptional 10.0% |
| Dutch | 98.6 /100 | #83 | Exceptional 10.0% |
| Immigrants | Israel | 98.5 /100 | #84 | Exceptional 10.0% |
| Immigrants | Romania | 98.5 /100 | #85 | Exceptional 10.0% |
| Immigrants | Norway | 98.4 /100 | #86 | Exceptional 10.0% |
| Egyptians | 98.4 /100 | #87 | Exceptional 10.0% |
| Immigrants | Kuwait | 98.4 /100 | #88 | Exceptional 10.0% |
| Immigrants | France | 98.3 /100 | #89 | Exceptional 10.1% |
Demographics Similar to Spanish American Indians by Receiving Food Stamps
In terms of receiving food stamps, the demographic groups most similar to Spanish American Indians are Ecuadorian (14.9%, a difference of 0.32%), Kiowa (14.9%, a difference of 0.37%), Immigrants from Central America (15.0%, a difference of 0.52%), Belizean (14.8%, a difference of 0.64%), and Seminole (14.8%, a difference of 0.77%).
| Demographics | Rating | Rank | Receiving Food Stamps |
| Immigrants | Western Africa | 0.1 /100 | #274 | Tragic 14.7% |
| Ute | 0.1 /100 | #275 | Tragic 14.7% |
| Liberians | 0.1 /100 | #276 | Tragic 14.8% |
| Seminole | 0.1 /100 | #277 | Tragic 14.8% |
| Belizeans | 0.1 /100 | #278 | Tragic 14.8% |
| Kiowa | 0.0 /100 | #279 | Tragic 14.9% |
| Ecuadorians | 0.0 /100 | #280 | Tragic 14.9% |
| Spanish American Indians | 0.0 /100 | #281 | Tragic 14.9% |
| Immigrants | Central America | 0.0 /100 | #282 | Tragic 15.0% |
| Bangladeshis | 0.0 /100 | #283 | Tragic 15.0% |
| Immigrants | Ecuador | 0.0 /100 | #284 | Tragic 15.0% |
| Immigrants | Liberia | 0.0 /100 | #285 | Tragic 15.1% |
| Africans | 0.0 /100 | #286 | Tragic 15.1% |
| Immigrants | Mexico | 0.0 /100 | #287 | Tragic 15.2% |
| Immigrants | Belize | 0.0 /100 | #288 | Tragic 15.2% |