Immigrants from Somalia vs Northern European Female Poverty
COMPARE
Immigrants from Somalia
Northern European
Female Poverty
Female Poverty Comparison
Immigrants from Somalia
Northern Europeans
17.0%
FEMALE POVERTY
0.0/ 100
METRIC RATING
312th/ 347
METRIC RANK
12.4%
FEMALE POVERTY
96.6/ 100
METRIC RATING
84th/ 347
METRIC RANK
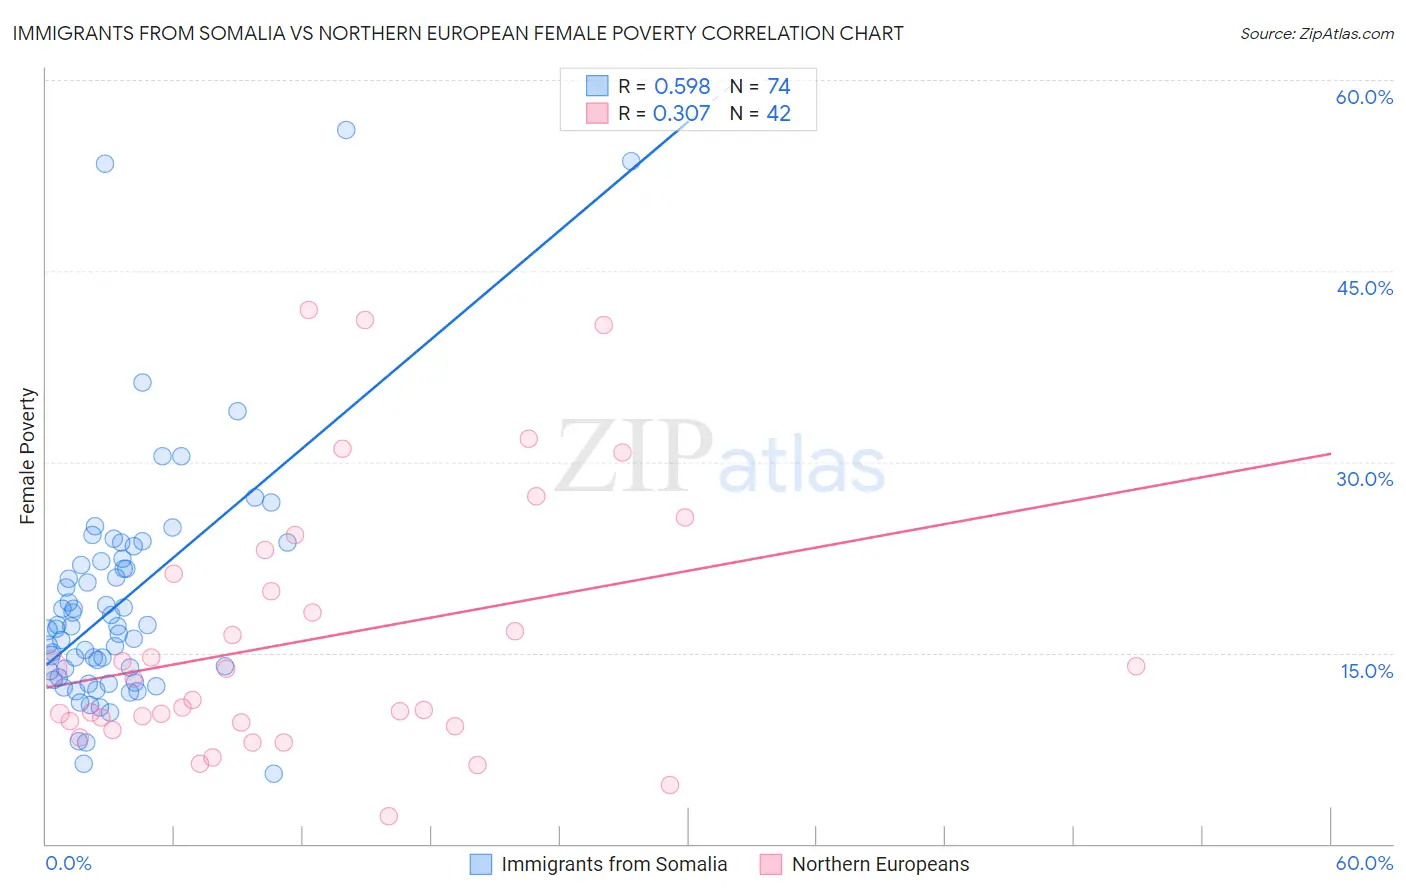
Immigrants from Somalia vs Northern European Female Poverty Correlation Chart
The statistical analysis conducted on geographies consisting of 92,101,870 people shows a substantial positive correlation between the proportion of Immigrants from Somalia and poverty level among females in the United States with a correlation coefficient (R) of 0.598 and weighted average of 17.0%. Similarly, the statistical analysis conducted on geographies consisting of 405,818,739 people shows a mild positive correlation between the proportion of Northern Europeans and poverty level among females in the United States with a correlation coefficient (R) of 0.307 and weighted average of 12.4%, a difference of 37.7%.
Female Poverty Correlation Summary
| Measurement | Immigrants from Somalia | Northern European |
| Minimum | 5.5% | 2.2% |
| Maximum | 56.1% | 41.9% |
| Range | 50.6% | 39.7% |
| Mean | 19.1% | 16.1% |
| Median | 17.0% | 12.1% |
| Interquartile 25% (IQ1) | 13.1% | 9.5% |
| Interquartile 75% (IQ3) | 22.1% | 21.2% |
| Interquartile Range (IQR) | 9.1% | 11.6% |
| Standard Deviation (Sample) | 9.5% | 10.2% |
| Standard Deviation (Population) | 9.4% | 10.1% |
Similar Demographics by Female Poverty
Demographics Similar to Immigrants from Somalia by Female Poverty
In terms of female poverty, the demographic groups most similar to Immigrants from Somalia are British West Indian (17.0%, a difference of 0.080%), Immigrants from Guatemala (17.0%, a difference of 0.090%), Creek (17.0%, a difference of 0.10%), Dutch West Indian (17.1%, a difference of 0.33%), and Immigrants from Mexico (17.0%, a difference of 0.34%).
| Demographics | Rating | Rank | Female Poverty |
| Immigrants | Grenada | 0.0 /100 | #305 | Tragic 16.8% |
| Immigrants | Caribbean | 0.0 /100 | #306 | Tragic 16.9% |
| Seminole | 0.0 /100 | #307 | Tragic 16.9% |
| Africans | 0.0 /100 | #308 | Tragic 16.9% |
| Immigrants | Mexico | 0.0 /100 | #309 | Tragic 17.0% |
| Creek | 0.0 /100 | #310 | Tragic 17.0% |
| Immigrants | Guatemala | 0.0 /100 | #311 | Tragic 17.0% |
| Immigrants | Somalia | 0.0 /100 | #312 | Tragic 17.0% |
| British West Indians | 0.0 /100 | #313 | Tragic 17.0% |
| Dutch West Indians | 0.0 /100 | #314 | Tragic 17.1% |
| U.S. Virgin Islanders | 0.0 /100 | #315 | Tragic 17.3% |
| Hondurans | 0.0 /100 | #316 | Tragic 17.4% |
| Immigrants | Congo | 0.0 /100 | #317 | Tragic 17.4% |
| Ute | 0.0 /100 | #318 | Tragic 17.5% |
| Cajuns | 0.0 /100 | #319 | Tragic 17.5% |
Demographics Similar to Northern Europeans by Female Poverty
In terms of female poverty, the demographic groups most similar to Northern Europeans are Irish (12.4%, a difference of 0.050%), Dutch (12.4%, a difference of 0.080%), Okinawan (12.4%, a difference of 0.10%), Finnish (12.4%, a difference of 0.15%), and Immigrants from England (12.3%, a difference of 0.23%).
| Demographics | Rating | Rank | Female Poverty |
| Serbians | 97.2 /100 | #77 | Exceptional 12.3% |
| Egyptians | 97.2 /100 | #78 | Exceptional 12.3% |
| Immigrants | North America | 97.1 /100 | #79 | Exceptional 12.3% |
| Slovaks | 97.1 /100 | #80 | Exceptional 12.3% |
| Immigrants | Sweden | 97.1 /100 | #81 | Exceptional 12.3% |
| Jordanians | 97.1 /100 | #82 | Exceptional 12.3% |
| Immigrants | England | 96.9 /100 | #83 | Exceptional 12.3% |
| Northern Europeans | 96.6 /100 | #84 | Exceptional 12.4% |
| Irish | 96.5 /100 | #85 | Exceptional 12.4% |
| Dutch | 96.5 /100 | #86 | Exceptional 12.4% |
| Okinawans | 96.4 /100 | #87 | Exceptional 12.4% |
| Finns | 96.4 /100 | #88 | Exceptional 12.4% |
| English | 96.1 /100 | #89 | Exceptional 12.4% |
| Immigrants | Denmark | 95.8 /100 | #90 | Exceptional 12.4% |
| Belgians | 95.8 /100 | #91 | Exceptional 12.4% |