Assyrian/Chaldean/Syriac vs Immigrants from Australia Single Female Poverty
COMPARE
Assyrian/Chaldean/Syriac
Immigrants from Australia
Single Female Poverty
Single Female Poverty Comparison
Assyrians/Chaldeans/Syriacs
Immigrants from Australia
17.0%
SINGLE FEMALE POVERTY
100.0/ 100
METRIC RATING
5th/ 347
METRIC RANK
19.4%
SINGLE FEMALE POVERTY
99.3/ 100
METRIC RATING
80th/ 347
METRIC RANK
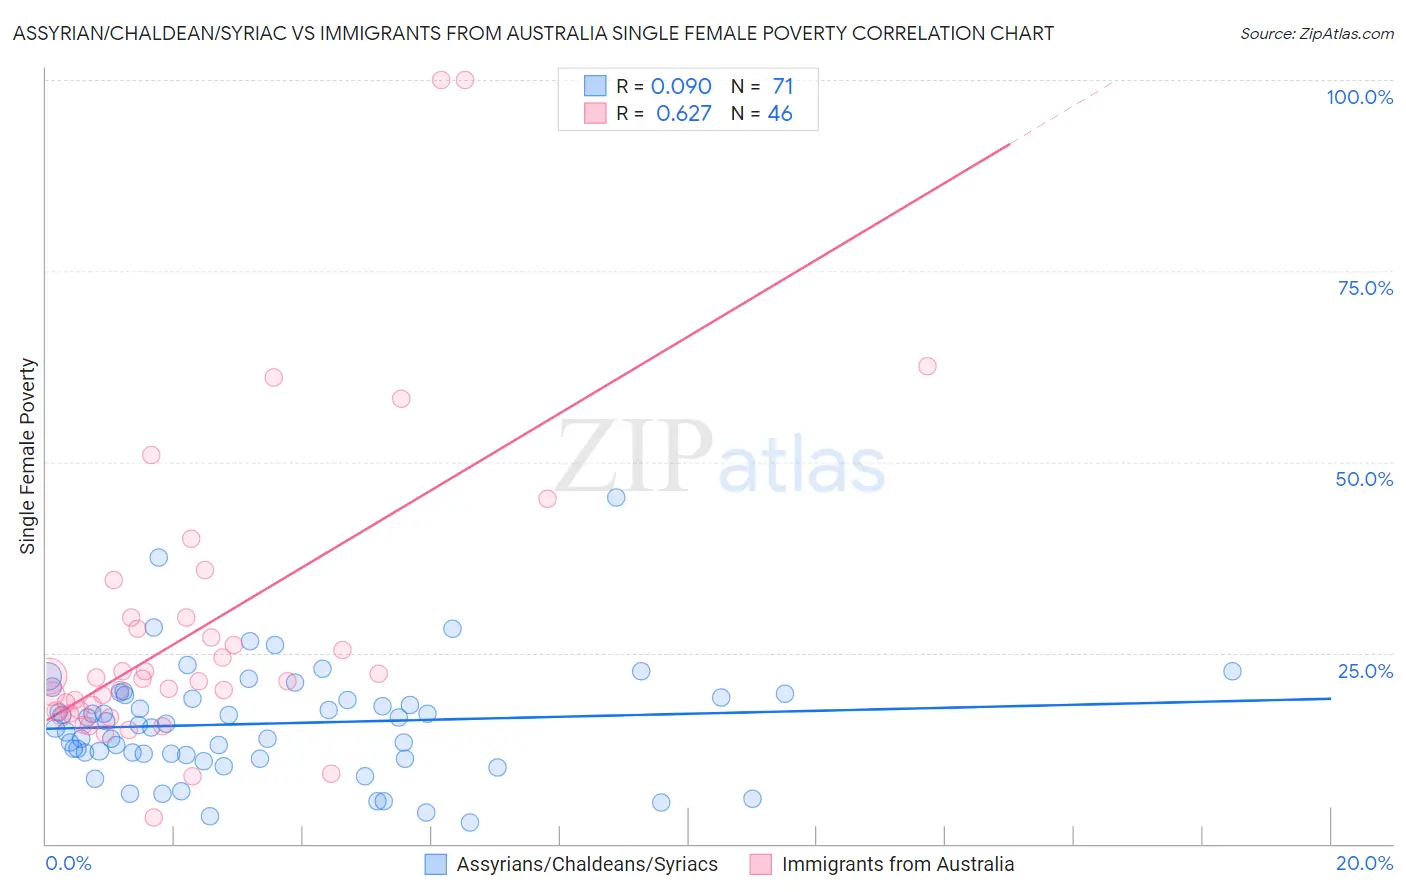
Assyrian/Chaldean/Syriac vs Immigrants from Australia Single Female Poverty Correlation Chart
The statistical analysis conducted on geographies consisting of 109,756,092 people shows a slight positive correlation between the proportion of Assyrians/Chaldeans/Syriacs and poverty level among single females in the United States with a correlation coefficient (R) of 0.090 and weighted average of 17.0%. Similarly, the statistical analysis conducted on geographies consisting of 224,453,715 people shows a significant positive correlation between the proportion of Immigrants from Australia and poverty level among single females in the United States with a correlation coefficient (R) of 0.627 and weighted average of 19.4%, a difference of 14.5%.
Single Female Poverty Correlation Summary
| Measurement | Assyrian/Chaldean/Syriac | Immigrants from Australia |
| Minimum | 2.7% | 3.5% |
| Maximum | 45.3% | 100.0% |
| Range | 42.5% | 96.5% |
| Mean | 15.7% | 28.1% |
| Median | 15.6% | 21.4% |
| Interquartile 25% (IQ1) | 11.7% | 17.3% |
| Interquartile 75% (IQ3) | 19.6% | 29.7% |
| Interquartile Range (IQR) | 7.9% | 12.3% |
| Standard Deviation (Sample) | 7.4% | 20.2% |
| Standard Deviation (Population) | 7.3% | 20.0% |
Similar Demographics by Single Female Poverty
Demographics Similar to Assyrians/Chaldeans/Syriacs by Single Female Poverty
In terms of single female poverty, the demographic groups most similar to Assyrians/Chaldeans/Syriacs are Filipino (17.0%, a difference of 0.20%), Immigrants from India (16.8%, a difference of 0.83%), Thai (17.3%, a difference of 1.9%), Immigrants from Hong Kong (16.5%, a difference of 2.6%), and Immigrants from Iran (17.5%, a difference of 3.0%).
| Demographics | Rating | Rank | Single Female Poverty |
| Chinese | 100.0 /100 | #1 | Exceptional 16.1% |
| Immigrants | Taiwan | 100.0 /100 | #2 | Exceptional 16.4% |
| Immigrants | Hong Kong | 100.0 /100 | #3 | Exceptional 16.5% |
| Immigrants | India | 100.0 /100 | #4 | Exceptional 16.8% |
| Assyrians/Chaldeans/Syriacs | 100.0 /100 | #5 | Exceptional 17.0% |
| Filipinos | 100.0 /100 | #6 | Exceptional 17.0% |
| Thais | 100.0 /100 | #7 | Exceptional 17.3% |
| Immigrants | Iran | 100.0 /100 | #8 | Exceptional 17.5% |
| Bhutanese | 100.0 /100 | #9 | Exceptional 17.7% |
| Immigrants | Ireland | 100.0 /100 | #10 | Exceptional 17.8% |
| Immigrants | Lithuania | 100.0 /100 | #11 | Exceptional 17.8% |
| Immigrants | South Central Asia | 100.0 /100 | #12 | Exceptional 17.8% |
| Immigrants | Bolivia | 100.0 /100 | #13 | Exceptional 17.8% |
| Bolivians | 100.0 /100 | #14 | Exceptional 17.9% |
| Indians (Asian) | 100.0 /100 | #15 | Exceptional 17.9% |
Demographics Similar to Immigrants from Australia by Single Female Poverty
In terms of single female poverty, the demographic groups most similar to Immigrants from Australia are Immigrants from Scotland (19.4%, a difference of 0.020%), Immigrants from Malaysia (19.4%, a difference of 0.030%), Immigrants from Sierra Leone (19.4%, a difference of 0.040%), Taiwanese (19.4%, a difference of 0.050%), and Albanian (19.4%, a difference of 0.060%).
| Demographics | Rating | Rank | Single Female Poverty |
| Immigrants | Peru | 99.4 /100 | #73 | Exceptional 19.3% |
| Immigrants | Belarus | 99.4 /100 | #74 | Exceptional 19.3% |
| Immigrants | Turkey | 99.4 /100 | #75 | Exceptional 19.4% |
| Peruvians | 99.4 /100 | #76 | Exceptional 19.4% |
| Immigrants | Russia | 99.3 /100 | #77 | Exceptional 19.4% |
| Albanians | 99.3 /100 | #78 | Exceptional 19.4% |
| Immigrants | Sierra Leone | 99.3 /100 | #79 | Exceptional 19.4% |
| Immigrants | Australia | 99.3 /100 | #80 | Exceptional 19.4% |
| Immigrants | Scotland | 99.2 /100 | #81 | Exceptional 19.4% |
| Immigrants | Malaysia | 99.2 /100 | #82 | Exceptional 19.4% |
| Taiwanese | 99.2 /100 | #83 | Exceptional 19.4% |
| Immigrants | Sweden | 99.2 /100 | #84 | Exceptional 19.4% |
| Immigrants | Albania | 99.2 /100 | #85 | Exceptional 19.4% |
| Greeks | 99.2 /100 | #86 | Exceptional 19.4% |
| Zimbabweans | 99.0 /100 | #87 | Exceptional 19.5% |