Assyrian/Chaldean/Syriac vs British Single Female Poverty
COMPARE
Assyrian/Chaldean/Syriac
British
Single Female Poverty
Single Female Poverty Comparison
Assyrians/Chaldeans/Syriacs
British
17.0%
SINGLE FEMALE POVERTY
100.0/ 100
METRIC RATING
5th/ 347
METRIC RANK
21.1%
SINGLE FEMALE POVERTY
42.9/ 100
METRIC RATING
179th/ 347
METRIC RANK
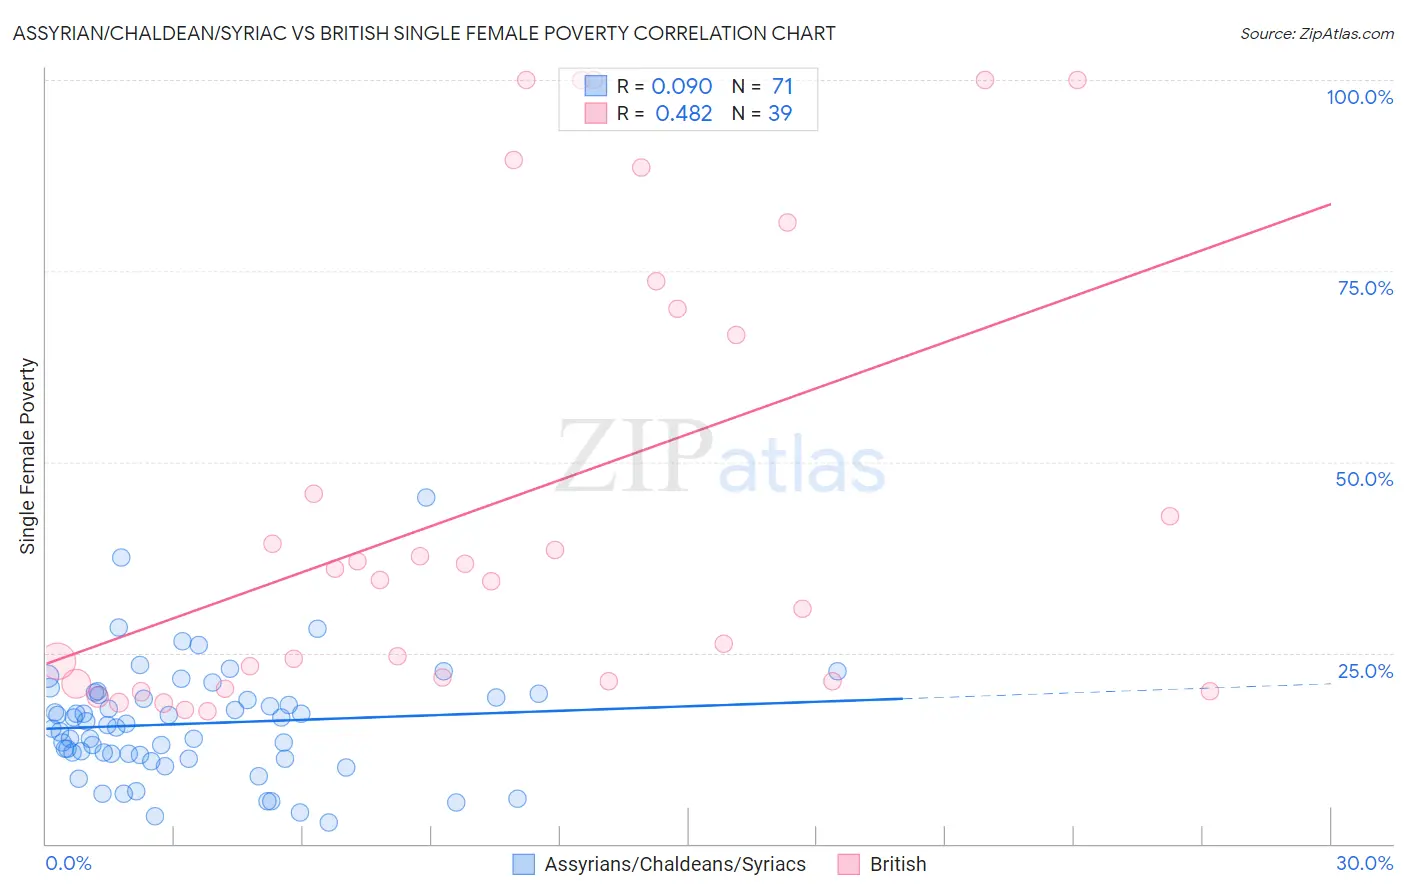
Assyrian/Chaldean/Syriac vs British Single Female Poverty Correlation Chart
The statistical analysis conducted on geographies consisting of 109,756,092 people shows a slight positive correlation between the proportion of Assyrians/Chaldeans/Syriacs and poverty level among single females in the United States with a correlation coefficient (R) of 0.090 and weighted average of 17.0%. Similarly, the statistical analysis conducted on geographies consisting of 516,545,848 people shows a moderate positive correlation between the proportion of British and poverty level among single females in the United States with a correlation coefficient (R) of 0.482 and weighted average of 21.1%, a difference of 24.5%.
Single Female Poverty Correlation Summary
| Measurement | Assyrian/Chaldean/Syriac | British |
| Minimum | 2.7% | 17.3% |
| Maximum | 45.3% | 100.0% |
| Range | 42.5% | 82.7% |
| Mean | 15.7% | 44.7% |
| Median | 15.6% | 34.5% |
| Interquartile 25% (IQ1) | 11.7% | 21.2% |
| Interquartile 75% (IQ3) | 19.6% | 70.0% |
| Interquartile Range (IQR) | 7.9% | 48.8% |
| Standard Deviation (Sample) | 7.4% | 29.4% |
| Standard Deviation (Population) | 7.3% | 29.0% |
Similar Demographics by Single Female Poverty
Demographics Similar to Assyrians/Chaldeans/Syriacs by Single Female Poverty
In terms of single female poverty, the demographic groups most similar to Assyrians/Chaldeans/Syriacs are Filipino (17.0%, a difference of 0.20%), Immigrants from India (16.8%, a difference of 0.83%), Thai (17.3%, a difference of 1.9%), Immigrants from Hong Kong (16.5%, a difference of 2.6%), and Immigrants from Iran (17.5%, a difference of 3.0%).
| Demographics | Rating | Rank | Single Female Poverty |
| Chinese | 100.0 /100 | #1 | Exceptional 16.1% |
| Immigrants | Taiwan | 100.0 /100 | #2 | Exceptional 16.4% |
| Immigrants | Hong Kong | 100.0 /100 | #3 | Exceptional 16.5% |
| Immigrants | India | 100.0 /100 | #4 | Exceptional 16.8% |
| Assyrians/Chaldeans/Syriacs | 100.0 /100 | #5 | Exceptional 17.0% |
| Filipinos | 100.0 /100 | #6 | Exceptional 17.0% |
| Thais | 100.0 /100 | #7 | Exceptional 17.3% |
| Immigrants | Iran | 100.0 /100 | #8 | Exceptional 17.5% |
| Bhutanese | 100.0 /100 | #9 | Exceptional 17.7% |
| Immigrants | Ireland | 100.0 /100 | #10 | Exceptional 17.8% |
| Immigrants | Lithuania | 100.0 /100 | #11 | Exceptional 17.8% |
| Immigrants | South Central Asia | 100.0 /100 | #12 | Exceptional 17.8% |
| Immigrants | Bolivia | 100.0 /100 | #13 | Exceptional 17.8% |
| Bolivians | 100.0 /100 | #14 | Exceptional 17.9% |
| Indians (Asian) | 100.0 /100 | #15 | Exceptional 17.9% |
Demographics Similar to British by Single Female Poverty
In terms of single female poverty, the demographic groups most similar to British are Spanish American Indian (21.1%, a difference of 0.030%), European (21.1%, a difference of 0.040%), Immigrants from Bosnia and Herzegovina (21.1%, a difference of 0.12%), Scandinavian (21.1%, a difference of 0.14%), and Slavic (21.1%, a difference of 0.15%).
| Demographics | Rating | Rank | Single Female Poverty |
| Guyanese | 52.0 /100 | #172 | Average 21.0% |
| Immigrants | Guyana | 50.6 /100 | #173 | Average 21.0% |
| Cubans | 50.0 /100 | #174 | Average 21.0% |
| Czechs | 46.8 /100 | #175 | Average 21.0% |
| Canadians | 45.4 /100 | #176 | Average 21.1% |
| Scandinavians | 45.2 /100 | #177 | Average 21.1% |
| Immigrants | Bosnia and Herzegovina | 44.9 /100 | #178 | Average 21.1% |
| British | 42.9 /100 | #179 | Average 21.1% |
| Spanish American Indians | 42.5 /100 | #180 | Average 21.1% |
| Europeans | 42.3 /100 | #181 | Average 21.1% |
| Slavs | 40.5 /100 | #182 | Average 21.1% |
| Slovaks | 39.7 /100 | #183 | Fair 21.1% |
| Hungarians | 39.6 /100 | #184 | Fair 21.1% |
| Immigrants | Cambodia | 38.2 /100 | #185 | Fair 21.2% |
| Hawaiians | 37.7 /100 | #186 | Fair 21.2% |