Asian vs Maltese Child Poverty Under the Age of 5
COMPARE
Asian
Maltese
Child Poverty Under the Age of 5
Child Poverty Under the Age of 5 Comparison
Asians
Maltese
14.0%
CHILD POVERTY UNDER THE AGE OF 5
99.9/ 100
METRIC RATING
24th/ 347
METRIC RANK
14.5%
CHILD POVERTY UNDER THE AGE OF 5
99.8/ 100
METRIC RATING
36th/ 347
METRIC RANK
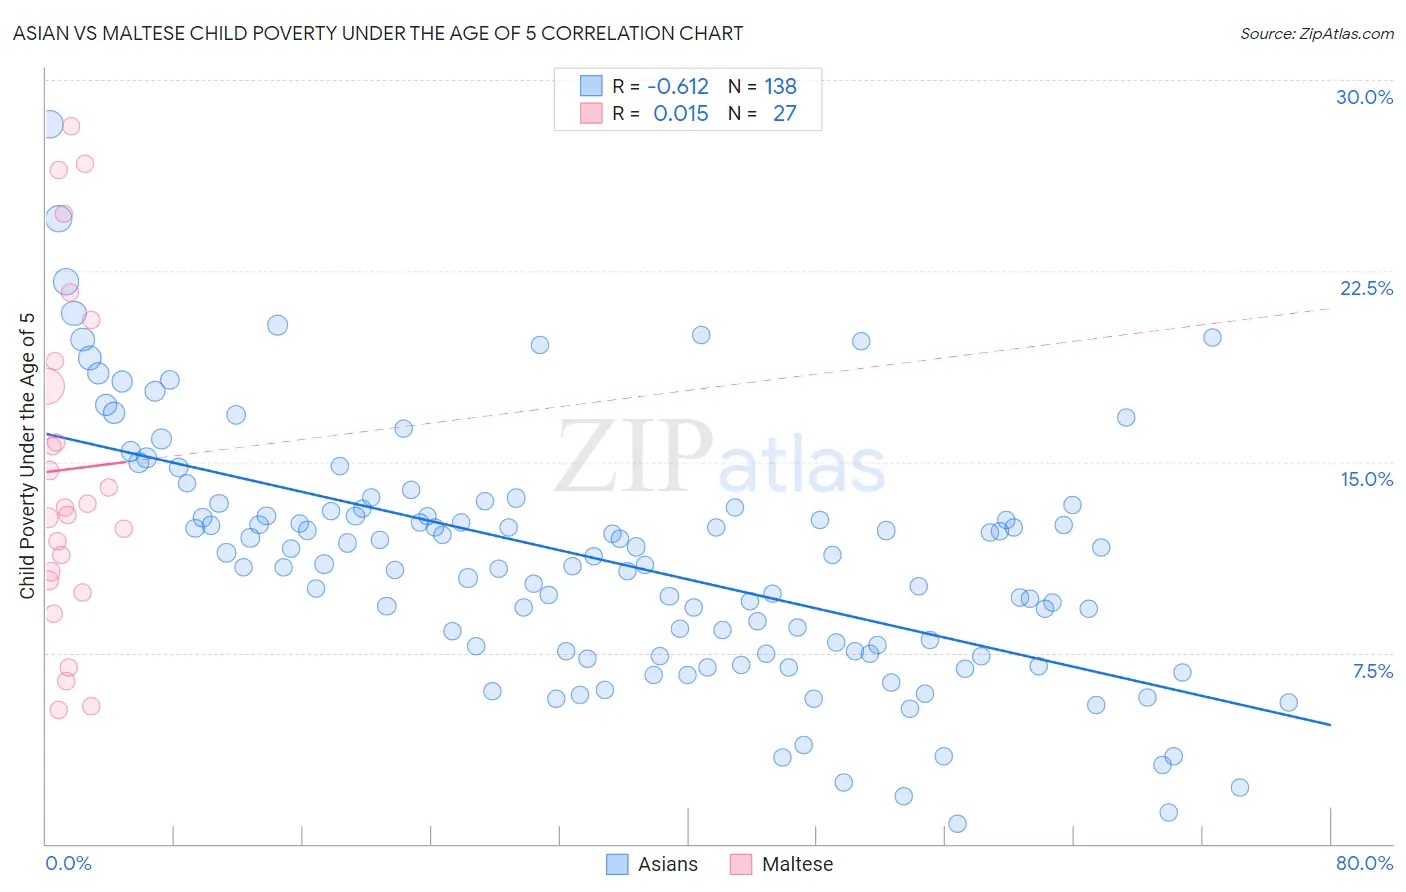
Asian vs Maltese Child Poverty Under the Age of 5 Correlation Chart
The statistical analysis conducted on geographies consisting of 515,784,088 people shows a significant negative correlation between the proportion of Asians and poverty level among children under the age of 5 in the United States with a correlation coefficient (R) of -0.612 and weighted average of 14.0%. Similarly, the statistical analysis conducted on geographies consisting of 123,026,696 people shows no correlation between the proportion of Maltese and poverty level among children under the age of 5 in the United States with a correlation coefficient (R) of 0.015 and weighted average of 14.5%, a difference of 3.9%.
Child Poverty Under the Age of 5 Correlation Summary
| Measurement | Asian | Maltese |
| Minimum | 0.77% | 5.2% |
| Maximum | 28.3% | 28.2% |
| Range | 27.5% | 23.0% |
| Mean | 11.1% | 14.7% |
| Median | 11.1% | 13.2% |
| Interquartile 25% (IQ1) | 7.6% | 10.4% |
| Interquartile 75% (IQ3) | 13.2% | 19.0% |
| Interquartile Range (IQR) | 5.6% | 8.6% |
| Standard Deviation (Sample) | 4.8% | 6.5% |
| Standard Deviation (Population) | 4.8% | 6.4% |
Demographics Similar to Asians and Maltese by Child Poverty Under the Age of 5
In terms of child poverty under the age of 5, the demographic groups most similar to Asians are Cypriot (14.0%, a difference of 0.0%), Bulgarian (13.9%, a difference of 0.51%), Immigrants from Lithuania (14.1%, a difference of 0.93%), Immigrants from Bolivia (13.8%, a difference of 0.96%), and Bolivian (13.8%, a difference of 1.0%). Similarly, the demographic groups most similar to Maltese are Latvian (14.5%, a difference of 0.070%), Immigrants from Moldova (14.5%, a difference of 0.080%), Taiwanese (14.5%, a difference of 0.18%), Turkish (14.6%, a difference of 0.34%), and Immigrants from Sri Lanka (14.4%, a difference of 0.48%).
| Demographics | Rating | Rank | Child Poverty Under the Age of 5 |
| Immigrants | Japan | 100.0 /100 | #20 | Exceptional 13.8% |
| Bolivians | 100.0 /100 | #21 | Exceptional 13.8% |
| Immigrants | Bolivia | 100.0 /100 | #22 | Exceptional 13.8% |
| Bulgarians | 99.9 /100 | #23 | Exceptional 13.9% |
| Asians | 99.9 /100 | #24 | Exceptional 14.0% |
| Cypriots | 99.9 /100 | #25 | Exceptional 14.0% |
| Immigrants | Lithuania | 99.9 /100 | #26 | Exceptional 14.1% |
| Tongans | 99.9 /100 | #27 | Exceptional 14.2% |
| Immigrants | Indonesia | 99.8 /100 | #28 | Exceptional 14.3% |
| Immigrants | Asia | 99.8 /100 | #29 | Exceptional 14.4% |
| Cambodians | 99.8 /100 | #30 | Exceptional 14.4% |
| Koreans | 99.8 /100 | #31 | Exceptional 14.4% |
| Immigrants | Sri Lanka | 99.8 /100 | #32 | Exceptional 14.4% |
| Taiwanese | 99.8 /100 | #33 | Exceptional 14.5% |
| Immigrants | Moldova | 99.8 /100 | #34 | Exceptional 14.5% |
| Latvians | 99.8 /100 | #35 | Exceptional 14.5% |
| Maltese | 99.8 /100 | #36 | Exceptional 14.5% |
| Turks | 99.7 /100 | #37 | Exceptional 14.6% |
| Eastern Europeans | 99.7 /100 | #38 | Exceptional 14.6% |
| Norwegians | 99.7 /100 | #39 | Exceptional 14.6% |
| Immigrants | Australia | 99.7 /100 | #40 | Exceptional 14.6% |