Asian vs Immigrants from Hong Kong Child Poverty Under the Age of 5
COMPARE
Asian
Immigrants from Hong Kong
Child Poverty Under the Age of 5
Child Poverty Under the Age of 5 Comparison
Asians
Immigrants from Hong Kong
14.0%
CHILD POVERTY UNDER THE AGE OF 5
99.9/ 100
METRIC RATING
24th/ 347
METRIC RANK
12.4%
CHILD POVERTY UNDER THE AGE OF 5
100.0/ 100
METRIC RATING
5th/ 347
METRIC RANK
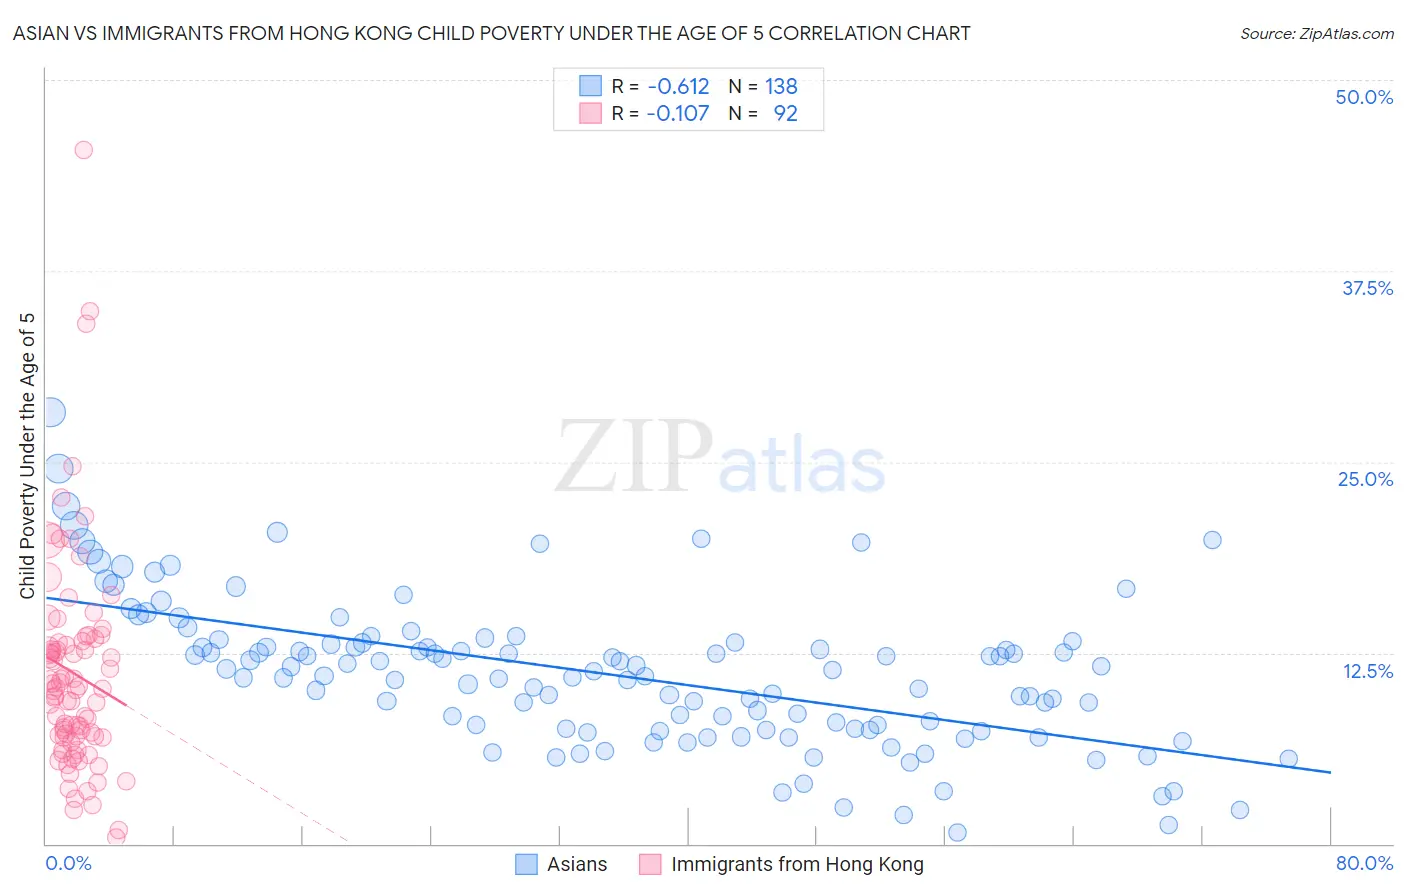
Asian vs Immigrants from Hong Kong Child Poverty Under the Age of 5 Correlation Chart
The statistical analysis conducted on geographies consisting of 515,784,088 people shows a significant negative correlation between the proportion of Asians and poverty level among children under the age of 5 in the United States with a correlation coefficient (R) of -0.612 and weighted average of 14.0%. Similarly, the statistical analysis conducted on geographies consisting of 244,450,571 people shows a poor negative correlation between the proportion of Immigrants from Hong Kong and poverty level among children under the age of 5 in the United States with a correlation coefficient (R) of -0.107 and weighted average of 12.4%, a difference of 12.3%.
Child Poverty Under the Age of 5 Correlation Summary
| Measurement | Asian | Immigrants from Hong Kong |
| Minimum | 0.77% | 0.42% |
| Maximum | 28.3% | 45.5% |
| Range | 27.5% | 45.0% |
| Mean | 11.1% | 11.1% |
| Median | 11.1% | 10.1% |
| Interquartile 25% (IQ1) | 7.6% | 7.0% |
| Interquartile 75% (IQ3) | 13.2% | 13.2% |
| Interquartile Range (IQR) | 5.6% | 6.2% |
| Standard Deviation (Sample) | 4.8% | 7.1% |
| Standard Deviation (Population) | 4.8% | 7.0% |
Demographics Similar to Asians and Immigrants from Hong Kong by Child Poverty Under the Age of 5
In terms of child poverty under the age of 5, the demographic groups most similar to Asians are Bulgarian (13.9%, a difference of 0.51%), Immigrants from Bolivia (13.8%, a difference of 0.96%), Bolivian (13.8%, a difference of 1.0%), Immigrants from Japan (13.8%, a difference of 1.3%), and Immigrants from Ireland (13.7%, a difference of 1.8%). Similarly, the demographic groups most similar to Immigrants from Hong Kong are Thai (12.3%, a difference of 1.0%), Immigrants from Singapore (12.9%, a difference of 4.0%), Chinese (13.1%, a difference of 5.1%), Iranian (13.1%, a difference of 5.1%), and Immigrants from Iran (13.1%, a difference of 5.2%).
| Demographics | Rating | Rank | Child Poverty Under the Age of 5 |
| Thais | 100.0 /100 | #4 | Exceptional 12.3% |
| Immigrants | Hong Kong | 100.0 /100 | #5 | Exceptional 12.4% |
| Immigrants | Singapore | 100.0 /100 | #6 | Exceptional 12.9% |
| Chinese | 100.0 /100 | #7 | Exceptional 13.1% |
| Iranians | 100.0 /100 | #8 | Exceptional 13.1% |
| Immigrants | Iran | 100.0 /100 | #9 | Exceptional 13.1% |
| Burmese | 100.0 /100 | #10 | Exceptional 13.2% |
| Immigrants | Korea | 100.0 /100 | #11 | Exceptional 13.2% |
| Immigrants | South Central Asia | 100.0 /100 | #12 | Exceptional 13.3% |
| Bhutanese | 100.0 /100 | #13 | Exceptional 13.4% |
| Okinawans | 100.0 /100 | #14 | Exceptional 13.4% |
| Indians (Asian) | 100.0 /100 | #15 | Exceptional 13.4% |
| Immigrants | Eastern Asia | 100.0 /100 | #16 | Exceptional 13.5% |
| Assyrians/Chaldeans/Syriacs | 100.0 /100 | #17 | Exceptional 13.6% |
| Immigrants | China | 100.0 /100 | #18 | Exceptional 13.6% |
| Immigrants | Ireland | 100.0 /100 | #19 | Exceptional 13.7% |
| Immigrants | Japan | 100.0 /100 | #20 | Exceptional 13.8% |
| Bolivians | 100.0 /100 | #21 | Exceptional 13.8% |
| Immigrants | Bolivia | 100.0 /100 | #22 | Exceptional 13.8% |
| Bulgarians | 99.9 /100 | #23 | Exceptional 13.9% |
| Asians | 99.9 /100 | #24 | Exceptional 14.0% |