Asian vs Immigrants Child Poverty Under the Age of 5
COMPARE
Asian
Immigrants
Child Poverty Under the Age of 5
Child Poverty Under the Age of 5 Comparison
Asians
Immigrants
14.0%
CHILD POVERTY UNDER THE AGE OF 5
99.9/ 100
METRIC RATING
24th/ 347
METRIC RANK
18.2%
CHILD POVERTY UNDER THE AGE OF 5
9.9/ 100
METRIC RATING
207th/ 347
METRIC RANK
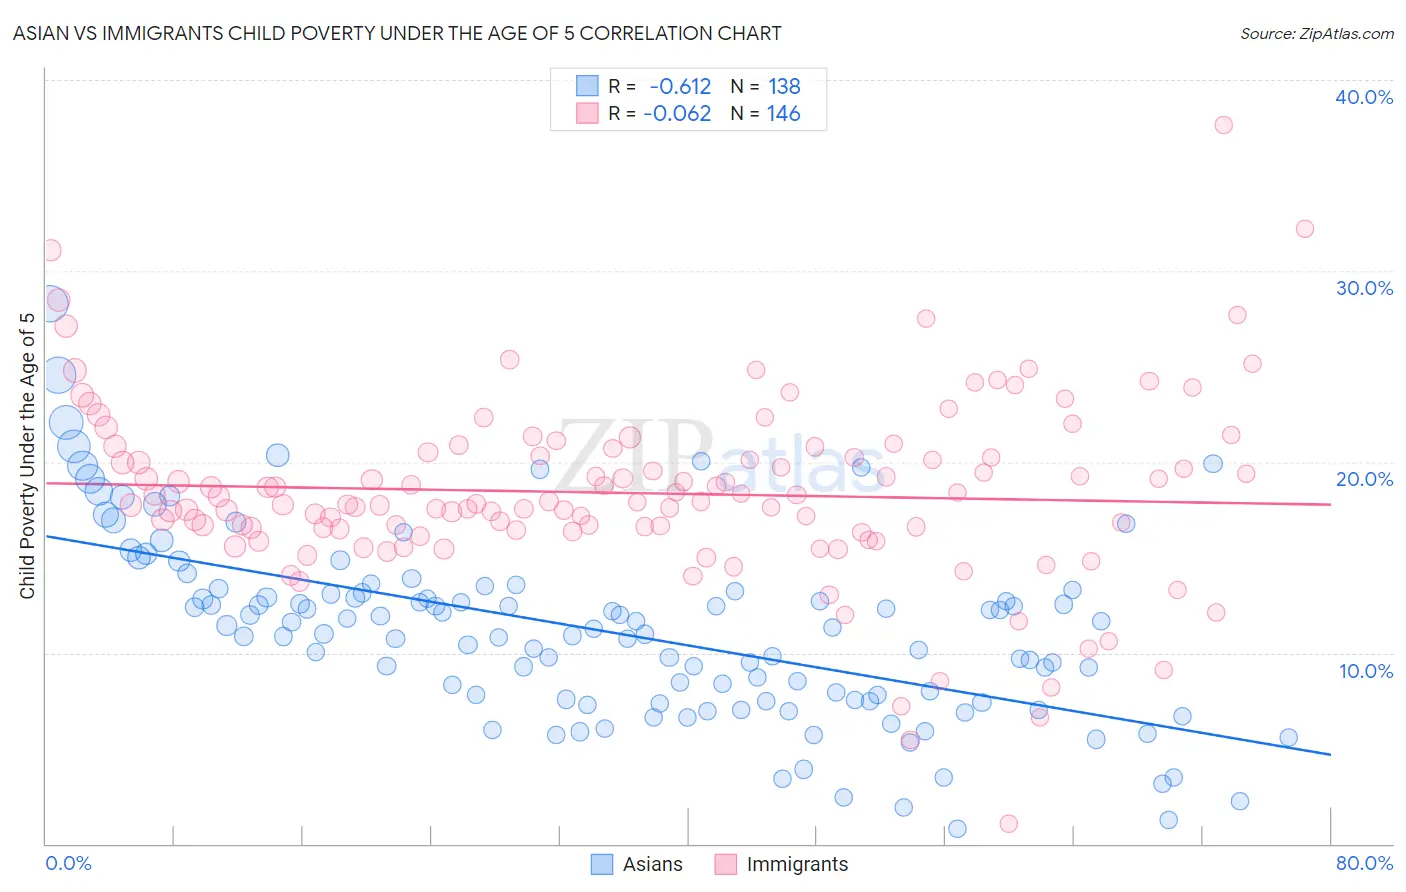
Asian vs Immigrants Child Poverty Under the Age of 5 Correlation Chart
The statistical analysis conducted on geographies consisting of 515,784,088 people shows a significant negative correlation between the proportion of Asians and poverty level among children under the age of 5 in the United States with a correlation coefficient (R) of -0.612 and weighted average of 14.0%. Similarly, the statistical analysis conducted on geographies consisting of 536,381,100 people shows a slight negative correlation between the proportion of Immigrants and poverty level among children under the age of 5 in the United States with a correlation coefficient (R) of -0.062 and weighted average of 18.2%, a difference of 30.5%.
Child Poverty Under the Age of 5 Correlation Summary
| Measurement | Asian | Immigrants |
| Minimum | 0.77% | 1.0% |
| Maximum | 28.3% | 37.7% |
| Range | 27.5% | 36.6% |
| Mean | 11.1% | 18.4% |
| Median | 11.1% | 17.9% |
| Interquartile 25% (IQ1) | 7.6% | 16.4% |
| Interquartile 75% (IQ3) | 13.2% | 20.5% |
| Interquartile Range (IQR) | 5.6% | 4.1% |
| Standard Deviation (Sample) | 4.8% | 4.8% |
| Standard Deviation (Population) | 4.8% | 4.8% |
Similar Demographics by Child Poverty Under the Age of 5
Demographics Similar to Asians by Child Poverty Under the Age of 5
In terms of child poverty under the age of 5, the demographic groups most similar to Asians are Cypriot (14.0%, a difference of 0.0%), Bulgarian (13.9%, a difference of 0.51%), Immigrants from Lithuania (14.1%, a difference of 0.93%), Immigrants from Bolivia (13.8%, a difference of 0.96%), and Bolivian (13.8%, a difference of 1.0%).
| Demographics | Rating | Rank | Child Poverty Under the Age of 5 |
| Assyrians/Chaldeans/Syriacs | 100.0 /100 | #17 | Exceptional 13.6% |
| Immigrants | China | 100.0 /100 | #18 | Exceptional 13.6% |
| Immigrants | Ireland | 100.0 /100 | #19 | Exceptional 13.7% |
| Immigrants | Japan | 100.0 /100 | #20 | Exceptional 13.8% |
| Bolivians | 100.0 /100 | #21 | Exceptional 13.8% |
| Immigrants | Bolivia | 100.0 /100 | #22 | Exceptional 13.8% |
| Bulgarians | 99.9 /100 | #23 | Exceptional 13.9% |
| Asians | 99.9 /100 | #24 | Exceptional 14.0% |
| Cypriots | 99.9 /100 | #25 | Exceptional 14.0% |
| Immigrants | Lithuania | 99.9 /100 | #26 | Exceptional 14.1% |
| Tongans | 99.9 /100 | #27 | Exceptional 14.2% |
| Immigrants | Indonesia | 99.8 /100 | #28 | Exceptional 14.3% |
| Immigrants | Asia | 99.8 /100 | #29 | Exceptional 14.4% |
| Cambodians | 99.8 /100 | #30 | Exceptional 14.4% |
| Koreans | 99.8 /100 | #31 | Exceptional 14.4% |
Demographics Similar to Immigrants by Child Poverty Under the Age of 5
In terms of child poverty under the age of 5, the demographic groups most similar to Immigrants are Scotch-Irish (18.2%, a difference of 0.020%), Spanish (18.2%, a difference of 0.020%), Panamanian (18.2%, a difference of 0.030%), Moroccan (18.2%, a difference of 0.12%), and Nepalese (18.3%, a difference of 0.33%).
| Demographics | Rating | Rank | Child Poverty Under the Age of 5 |
| Iraqis | 14.0 /100 | #200 | Poor 18.0% |
| Ugandans | 13.9 /100 | #201 | Poor 18.0% |
| Japanese | 13.8 /100 | #202 | Poor 18.1% |
| Immigrants | Cambodia | 13.7 /100 | #203 | Poor 18.1% |
| Immigrants | Eastern Africa | 13.4 /100 | #204 | Poor 18.1% |
| Spaniards | 12.8 /100 | #205 | Poor 18.1% |
| Whites/Caucasians | 12.6 /100 | #206 | Poor 18.1% |
| Immigrants | Immigrants | 9.9 /100 | #207 | Tragic 18.2% |
| Scotch-Irish | 9.8 /100 | #208 | Tragic 18.2% |
| Spanish | 9.8 /100 | #209 | Tragic 18.2% |
| Panamanians | 9.7 /100 | #210 | Tragic 18.2% |
| Moroccans | 9.4 /100 | #211 | Tragic 18.2% |
| Nepalese | 8.7 /100 | #212 | Tragic 18.3% |
| Immigrants | Thailand | 8.6 /100 | #213 | Tragic 18.3% |
| Malaysians | 6.5 /100 | #214 | Tragic 18.4% |