Argentinean vs Tsimshian Single Male Poverty
COMPARE
Argentinean
Tsimshian
Single Male Poverty
Single Male Poverty Comparison
Argentineans
Tsimshian
11.9%
SINGLE MALE POVERTY
99.5/ 100
METRIC RATING
73rd/ 347
METRIC RANK
11.1%
SINGLE MALE POVERTY
100.0/ 100
METRIC RATING
17th/ 347
METRIC RANK
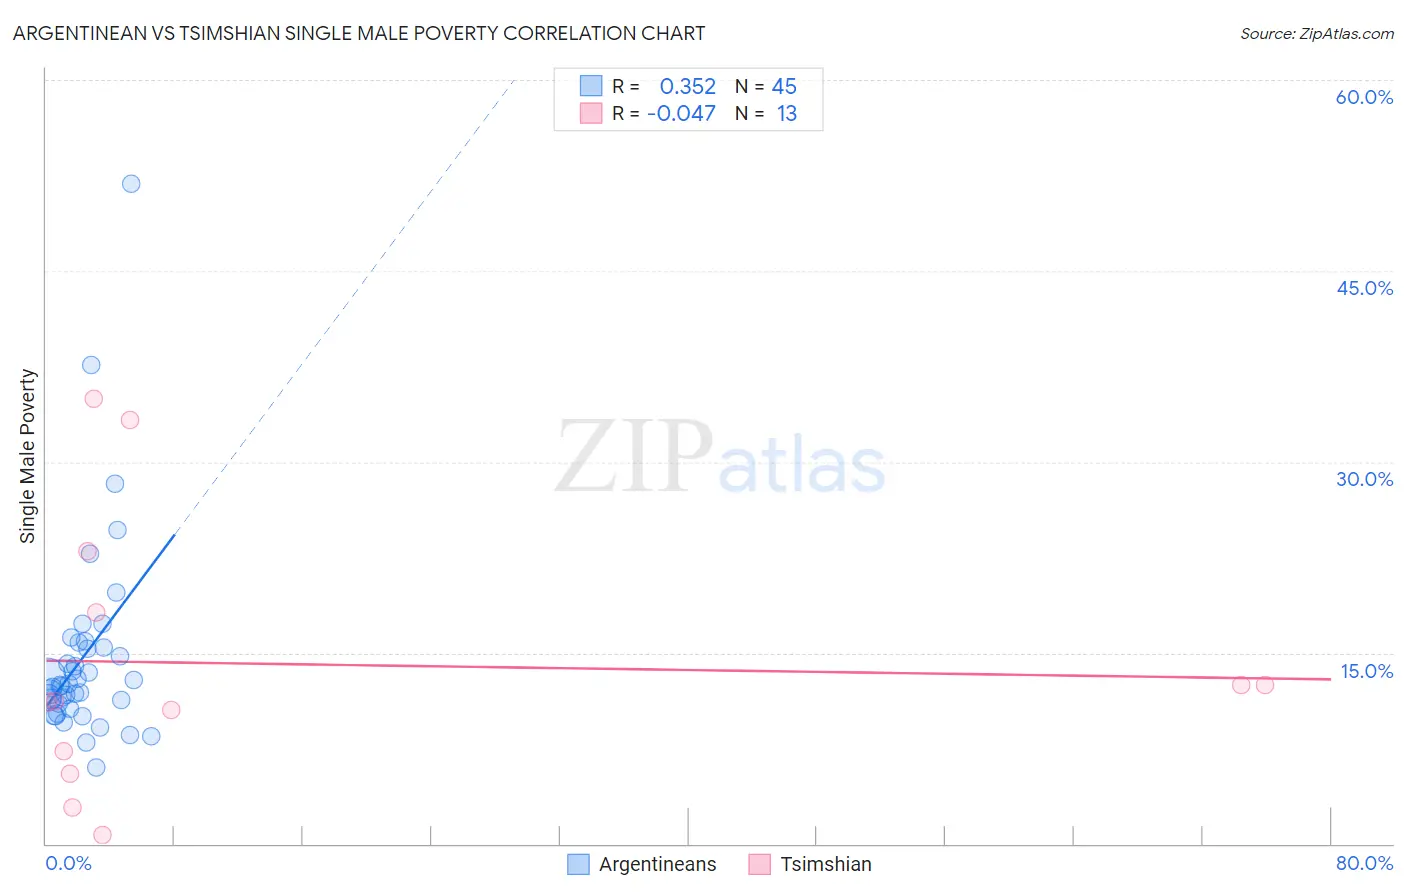
Argentinean vs Tsimshian Single Male Poverty Correlation Chart
The statistical analysis conducted on geographies consisting of 268,813,546 people shows a mild positive correlation between the proportion of Argentineans and poverty level among single males in the United States with a correlation coefficient (R) of 0.352 and weighted average of 11.9%. Similarly, the statistical analysis conducted on geographies consisting of 15,184,225 people shows no correlation between the proportion of Tsimshian and poverty level among single males in the United States with a correlation coefficient (R) of -0.047 and weighted average of 11.1%, a difference of 7.5%.
Single Male Poverty Correlation Summary
| Measurement | Argentinean | Tsimshian |
| Minimum | 6.0% | 0.66% |
| Maximum | 51.8% | 35.0% |
| Range | 45.8% | 34.3% |
| Mean | 14.7% | 14.1% |
| Median | 12.4% | 11.2% |
| Interquartile 25% (IQ1) | 10.8% | 6.4% |
| Interquartile 75% (IQ3) | 15.6% | 20.6% |
| Interquartile Range (IQR) | 4.8% | 14.2% |
| Standard Deviation (Sample) | 7.9% | 10.7% |
| Standard Deviation (Population) | 7.9% | 10.2% |
Similar Demographics by Single Male Poverty
Demographics Similar to Argentineans by Single Male Poverty
In terms of single male poverty, the demographic groups most similar to Argentineans are Chilean (11.9%, a difference of 0.060%), Immigrants from Argentina (11.9%, a difference of 0.13%), Uruguayan (11.9%, a difference of 0.25%), Immigrants from Northern Africa (11.9%, a difference of 0.27%), and Immigrants from Greece (11.9%, a difference of 0.31%).
| Demographics | Rating | Rank | Single Male Poverty |
| Immigrants | Uruguay | 99.6 /100 | #66 | Exceptional 11.9% |
| Immigrants | Ukraine | 99.6 /100 | #67 | Exceptional 11.9% |
| Immigrants | Croatia | 99.6 /100 | #68 | Exceptional 11.9% |
| Immigrants | Russia | 99.6 /100 | #69 | Exceptional 11.9% |
| Immigrants | Nepal | 99.6 /100 | #70 | Exceptional 11.9% |
| Immigrants | Greece | 99.6 /100 | #71 | Exceptional 11.9% |
| Immigrants | Argentina | 99.5 /100 | #72 | Exceptional 11.9% |
| Argentineans | 99.5 /100 | #73 | Exceptional 11.9% |
| Chileans | 99.5 /100 | #74 | Exceptional 11.9% |
| Uruguayans | 99.4 /100 | #75 | Exceptional 11.9% |
| Immigrants | Northern Africa | 99.4 /100 | #76 | Exceptional 11.9% |
| Immigrants | Malaysia | 99.2 /100 | #77 | Exceptional 12.0% |
| Immigrants | Venezuela | 99.1 /100 | #78 | Exceptional 12.0% |
| Immigrants | Belgium | 99.0 /100 | #79 | Exceptional 12.0% |
| Armenians | 98.7 /100 | #80 | Exceptional 12.1% |
Demographics Similar to Tsimshian by Single Male Poverty
In terms of single male poverty, the demographic groups most similar to Tsimshian are Bhutanese (11.1%, a difference of 0.090%), Immigrants from Bolivia (11.1%, a difference of 0.33%), Immigrants from Moldova (11.2%, a difference of 0.72%), Ethiopian (11.2%, a difference of 0.74%), and Korean (11.0%, a difference of 0.85%).
| Demographics | Rating | Rank | Single Male Poverty |
| Immigrants | Fiji | 100.0 /100 | #10 | Exceptional 10.9% |
| Immigrants | Philippines | 100.0 /100 | #11 | Exceptional 10.9% |
| Immigrants | Afghanistan | 100.0 /100 | #12 | Exceptional 10.9% |
| Immigrants | South Central Asia | 100.0 /100 | #13 | Exceptional 10.9% |
| Chinese | 100.0 /100 | #14 | Exceptional 11.0% |
| Koreans | 100.0 /100 | #15 | Exceptional 11.0% |
| Bhutanese | 100.0 /100 | #16 | Exceptional 11.1% |
| Tsimshian | 100.0 /100 | #17 | Exceptional 11.1% |
| Immigrants | Bolivia | 100.0 /100 | #18 | Exceptional 11.1% |
| Immigrants | Moldova | 100.0 /100 | #19 | Exceptional 11.2% |
| Ethiopians | 100.0 /100 | #20 | Exceptional 11.2% |
| Asians | 100.0 /100 | #21 | Exceptional 11.2% |
| Immigrants | Pakistan | 100.0 /100 | #22 | Exceptional 11.2% |
| Bolivians | 100.0 /100 | #23 | Exceptional 11.2% |
| Indians (Asian) | 100.0 /100 | #24 | Exceptional 11.3% |