Argentinean vs Spanish Single Male Poverty
COMPARE
Argentinean
Spanish
Single Male Poverty
Single Male Poverty Comparison
Argentineans
Spanish
11.9%
SINGLE MALE POVERTY
99.5/ 100
METRIC RATING
73rd/ 347
METRIC RANK
13.6%
SINGLE MALE POVERTY
1.0/ 100
METRIC RATING
249th/ 347
METRIC RANK
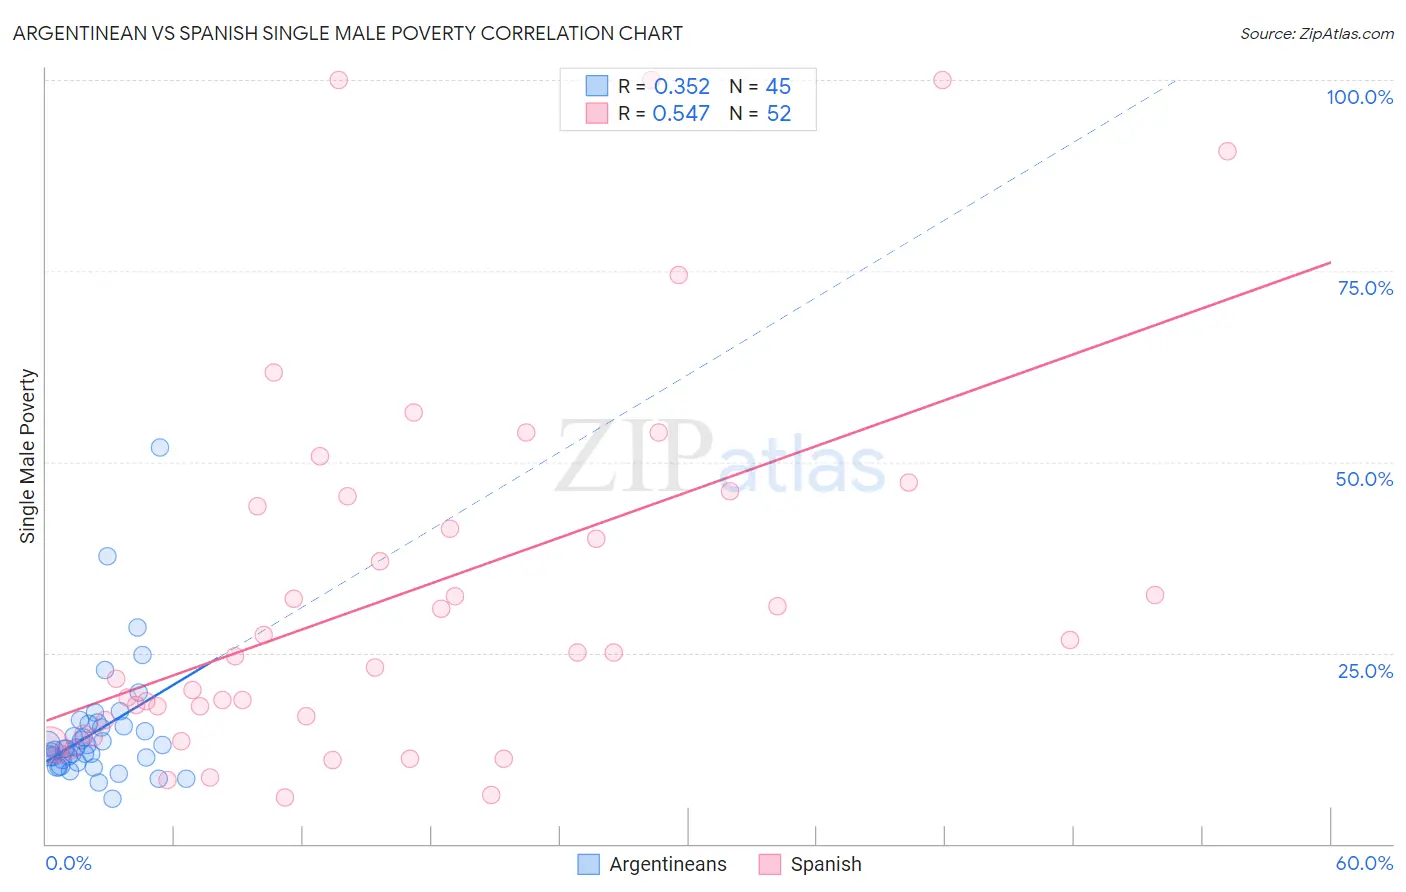
Argentinean vs Spanish Single Male Poverty Correlation Chart
The statistical analysis conducted on geographies consisting of 268,813,546 people shows a mild positive correlation between the proportion of Argentineans and poverty level among single males in the United States with a correlation coefficient (R) of 0.352 and weighted average of 11.9%. Similarly, the statistical analysis conducted on geographies consisting of 373,377,488 people shows a substantial positive correlation between the proportion of Spanish and poverty level among single males in the United States with a correlation coefficient (R) of 0.547 and weighted average of 13.6%, a difference of 14.0%.
Single Male Poverty Correlation Summary
| Measurement | Argentinean | Spanish |
| Minimum | 6.0% | 6.1% |
| Maximum | 51.8% | 100.0% |
| Range | 45.8% | 93.9% |
| Mean | 14.7% | 32.7% |
| Median | 12.4% | 24.8% |
| Interquartile 25% (IQ1) | 10.8% | 15.3% |
| Interquartile 75% (IQ3) | 15.6% | 44.8% |
| Interquartile Range (IQR) | 4.8% | 29.6% |
| Standard Deviation (Sample) | 7.9% | 24.7% |
| Standard Deviation (Population) | 7.9% | 24.4% |
Similar Demographics by Single Male Poverty
Demographics Similar to Argentineans by Single Male Poverty
In terms of single male poverty, the demographic groups most similar to Argentineans are Chilean (11.9%, a difference of 0.060%), Immigrants from Argentina (11.9%, a difference of 0.13%), Uruguayan (11.9%, a difference of 0.25%), Immigrants from Northern Africa (11.9%, a difference of 0.27%), and Immigrants from Greece (11.9%, a difference of 0.31%).
| Demographics | Rating | Rank | Single Male Poverty |
| Immigrants | Uruguay | 99.6 /100 | #66 | Exceptional 11.9% |
| Immigrants | Ukraine | 99.6 /100 | #67 | Exceptional 11.9% |
| Immigrants | Croatia | 99.6 /100 | #68 | Exceptional 11.9% |
| Immigrants | Russia | 99.6 /100 | #69 | Exceptional 11.9% |
| Immigrants | Nepal | 99.6 /100 | #70 | Exceptional 11.9% |
| Immigrants | Greece | 99.6 /100 | #71 | Exceptional 11.9% |
| Immigrants | Argentina | 99.5 /100 | #72 | Exceptional 11.9% |
| Argentineans | 99.5 /100 | #73 | Exceptional 11.9% |
| Chileans | 99.5 /100 | #74 | Exceptional 11.9% |
| Uruguayans | 99.4 /100 | #75 | Exceptional 11.9% |
| Immigrants | Northern Africa | 99.4 /100 | #76 | Exceptional 11.9% |
| Immigrants | Malaysia | 99.2 /100 | #77 | Exceptional 12.0% |
| Immigrants | Venezuela | 99.1 /100 | #78 | Exceptional 12.0% |
| Immigrants | Belgium | 99.0 /100 | #79 | Exceptional 12.0% |
| Armenians | 98.7 /100 | #80 | Exceptional 12.1% |
Demographics Similar to Spanish by Single Male Poverty
In terms of single male poverty, the demographic groups most similar to Spanish are Immigrants from Somalia (13.6%, a difference of 0.020%), Immigrants from Zaire (13.6%, a difference of 0.13%), Finnish (13.6%, a difference of 0.17%), Czech (13.5%, a difference of 0.24%), and Belgian (13.5%, a difference of 0.27%).
| Demographics | Rating | Rank | Single Male Poverty |
| Carpatho Rusyns | 2.1 /100 | #242 | Tragic 13.4% |
| Barbadians | 2.1 /100 | #243 | Tragic 13.4% |
| Immigrants | Senegal | 1.7 /100 | #244 | Tragic 13.5% |
| Immigrants | Latin America | 1.3 /100 | #245 | Tragic 13.5% |
| Immigrants | Micronesia | 1.2 /100 | #246 | Tragic 13.5% |
| Belgians | 1.2 /100 | #247 | Tragic 13.5% |
| Czechs | 1.2 /100 | #248 | Tragic 13.5% |
| Spanish | 1.0 /100 | #249 | Tragic 13.6% |
| Immigrants | Somalia | 1.0 /100 | #250 | Tragic 13.6% |
| Immigrants | Zaire | 0.9 /100 | #251 | Tragic 13.6% |
| Finns | 0.9 /100 | #252 | Tragic 13.6% |
| German Russians | 0.8 /100 | #253 | Tragic 13.6% |
| Sub-Saharan Africans | 0.5 /100 | #254 | Tragic 13.7% |
| Spaniards | 0.4 /100 | #255 | Tragic 13.7% |
| Immigrants | Belize | 0.4 /100 | #256 | Tragic 13.7% |