Argentinean vs Immigrants from Bulgaria Single Male Poverty
COMPARE
Argentinean
Immigrants from Bulgaria
Single Male Poverty
Single Male Poverty Comparison
Argentineans
Immigrants from Bulgaria
11.9%
SINGLE MALE POVERTY
99.5/ 100
METRIC RATING
73rd/ 347
METRIC RANK
11.6%
SINGLE MALE POVERTY
99.9/ 100
METRIC RATING
46th/ 347
METRIC RANK
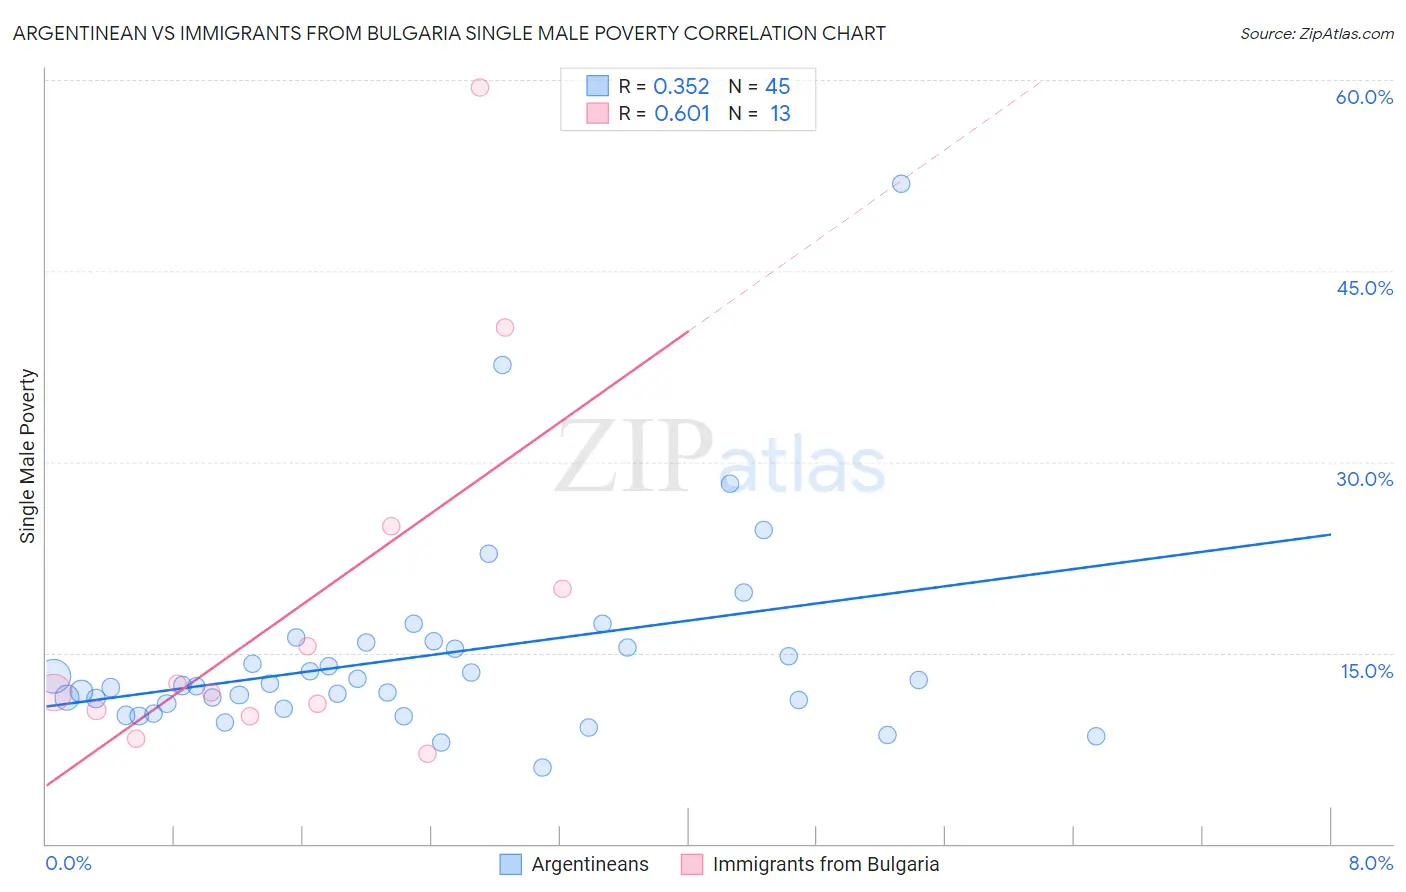
Argentinean vs Immigrants from Bulgaria Single Male Poverty Correlation Chart
The statistical analysis conducted on geographies consisting of 268,813,546 people shows a mild positive correlation between the proportion of Argentineans and poverty level among single males in the United States with a correlation coefficient (R) of 0.352 and weighted average of 11.9%. Similarly, the statistical analysis conducted on geographies consisting of 159,455,657 people shows a significant positive correlation between the proportion of Immigrants from Bulgaria and poverty level among single males in the United States with a correlation coefficient (R) of 0.601 and weighted average of 11.6%, a difference of 3.0%.
Single Male Poverty Correlation Summary
| Measurement | Argentinean | Immigrants from Bulgaria |
| Minimum | 6.0% | 7.0% |
| Maximum | 51.8% | 59.4% |
| Range | 45.8% | 52.3% |
| Mean | 14.7% | 18.7% |
| Median | 12.4% | 11.9% |
| Interquartile 25% (IQ1) | 10.8% | 10.3% |
| Interquartile 75% (IQ3) | 15.6% | 22.5% |
| Interquartile Range (IQR) | 4.8% | 12.2% |
| Standard Deviation (Sample) | 7.9% | 15.2% |
| Standard Deviation (Population) | 7.9% | 14.6% |
Similar Demographics by Single Male Poverty
Demographics Similar to Argentineans by Single Male Poverty
In terms of single male poverty, the demographic groups most similar to Argentineans are Chilean (11.9%, a difference of 0.060%), Immigrants from Argentina (11.9%, a difference of 0.13%), Uruguayan (11.9%, a difference of 0.25%), Immigrants from Northern Africa (11.9%, a difference of 0.27%), and Immigrants from Greece (11.9%, a difference of 0.31%).
| Demographics | Rating | Rank | Single Male Poverty |
| Immigrants | Uruguay | 99.6 /100 | #66 | Exceptional 11.9% |
| Immigrants | Ukraine | 99.6 /100 | #67 | Exceptional 11.9% |
| Immigrants | Croatia | 99.6 /100 | #68 | Exceptional 11.9% |
| Immigrants | Russia | 99.6 /100 | #69 | Exceptional 11.9% |
| Immigrants | Nepal | 99.6 /100 | #70 | Exceptional 11.9% |
| Immigrants | Greece | 99.6 /100 | #71 | Exceptional 11.9% |
| Immigrants | Argentina | 99.5 /100 | #72 | Exceptional 11.9% |
| Argentineans | 99.5 /100 | #73 | Exceptional 11.9% |
| Chileans | 99.5 /100 | #74 | Exceptional 11.9% |
| Uruguayans | 99.4 /100 | #75 | Exceptional 11.9% |
| Immigrants | Northern Africa | 99.4 /100 | #76 | Exceptional 11.9% |
| Immigrants | Malaysia | 99.2 /100 | #77 | Exceptional 12.0% |
| Immigrants | Venezuela | 99.1 /100 | #78 | Exceptional 12.0% |
| Immigrants | Belgium | 99.0 /100 | #79 | Exceptional 12.0% |
| Armenians | 98.7 /100 | #80 | Exceptional 12.1% |
Demographics Similar to Immigrants from Bulgaria by Single Male Poverty
In terms of single male poverty, the demographic groups most similar to Immigrants from Bulgaria are Immigrants from Poland (11.5%, a difference of 0.13%), Immigrants from Cameroon (11.5%, a difference of 0.15%), Immigrants from Peru (11.5%, a difference of 0.16%), Nepalese (11.6%, a difference of 0.20%), and Immigrants from Indonesia (11.6%, a difference of 0.27%).
| Demographics | Rating | Rank | Single Male Poverty |
| Soviet Union | 100.0 /100 | #39 | Exceptional 11.5% |
| Immigrants | Korea | 100.0 /100 | #40 | Exceptional 11.5% |
| Immigrants | Iraq | 99.9 /100 | #41 | Exceptional 11.5% |
| Egyptians | 99.9 /100 | #42 | Exceptional 11.5% |
| Immigrants | Peru | 99.9 /100 | #43 | Exceptional 11.5% |
| Immigrants | Cameroon | 99.9 /100 | #44 | Exceptional 11.5% |
| Immigrants | Poland | 99.9 /100 | #45 | Exceptional 11.5% |
| Immigrants | Bulgaria | 99.9 /100 | #46 | Exceptional 11.6% |
| Nepalese | 99.9 /100 | #47 | Exceptional 11.6% |
| Immigrants | Indonesia | 99.9 /100 | #48 | Exceptional 11.6% |
| Tlingit-Haida | 99.9 /100 | #49 | Exceptional 11.6% |
| Immigrants | Lithuania | 99.9 /100 | #50 | Exceptional 11.6% |
| Paraguayans | 99.9 /100 | #51 | Exceptional 11.6% |
| Samoans | 99.9 /100 | #52 | Exceptional 11.7% |
| Bulgarians | 99.9 /100 | #53 | Exceptional 11.7% |