Argentinean vs Hispanic or Latino Single Male Poverty
COMPARE
Argentinean
Hispanic or Latino
Single Male Poverty
Single Male Poverty Comparison
Argentineans
Hispanics or Latinos
11.9%
SINGLE MALE POVERTY
99.5/ 100
METRIC RATING
73rd/ 347
METRIC RANK
14.2%
SINGLE MALE POVERTY
0.0/ 100
METRIC RATING
281st/ 347
METRIC RANK
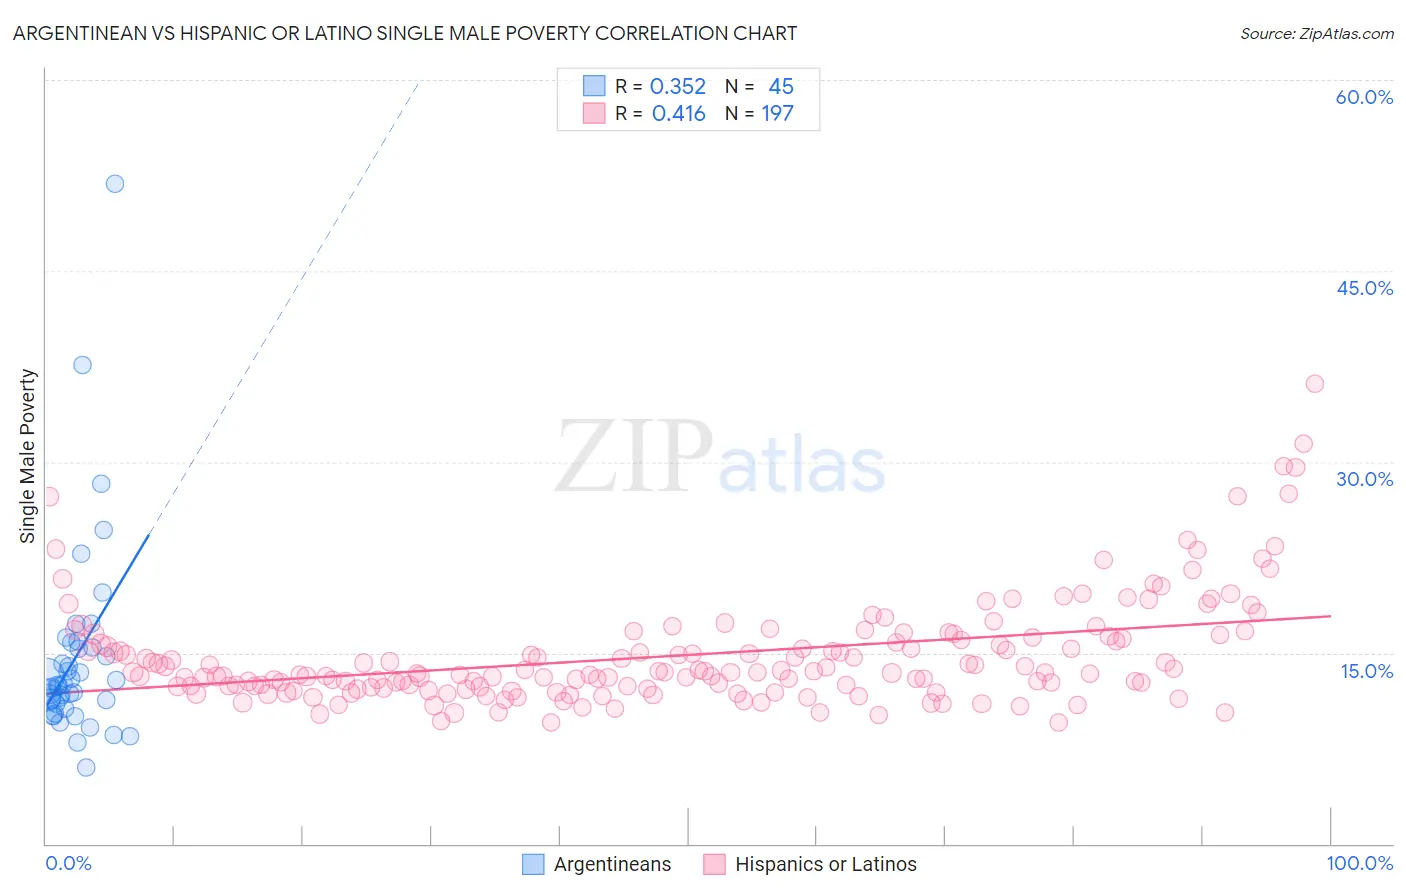
Argentinean vs Hispanic or Latino Single Male Poverty Correlation Chart
The statistical analysis conducted on geographies consisting of 268,813,546 people shows a mild positive correlation between the proportion of Argentineans and poverty level among single males in the United States with a correlation coefficient (R) of 0.352 and weighted average of 11.9%. Similarly, the statistical analysis conducted on geographies consisting of 473,841,382 people shows a moderate positive correlation between the proportion of Hispanics or Latinos and poverty level among single males in the United States with a correlation coefficient (R) of 0.416 and weighted average of 14.2%, a difference of 19.2%.
Single Male Poverty Correlation Summary
| Measurement | Argentinean | Hispanic or Latino |
| Minimum | 6.0% | 9.5% |
| Maximum | 51.8% | 36.1% |
| Range | 45.8% | 26.6% |
| Mean | 14.7% | 14.8% |
| Median | 12.4% | 13.5% |
| Interquartile 25% (IQ1) | 10.8% | 12.3% |
| Interquartile 75% (IQ3) | 15.6% | 16.2% |
| Interquartile Range (IQR) | 4.8% | 3.8% |
| Standard Deviation (Sample) | 7.9% | 4.2% |
| Standard Deviation (Population) | 7.9% | 4.2% |
Similar Demographics by Single Male Poverty
Demographics Similar to Argentineans by Single Male Poverty
In terms of single male poverty, the demographic groups most similar to Argentineans are Chilean (11.9%, a difference of 0.060%), Immigrants from Argentina (11.9%, a difference of 0.13%), Uruguayan (11.9%, a difference of 0.25%), Immigrants from Northern Africa (11.9%, a difference of 0.27%), and Immigrants from Greece (11.9%, a difference of 0.31%).
| Demographics | Rating | Rank | Single Male Poverty |
| Immigrants | Uruguay | 99.6 /100 | #66 | Exceptional 11.9% |
| Immigrants | Ukraine | 99.6 /100 | #67 | Exceptional 11.9% |
| Immigrants | Croatia | 99.6 /100 | #68 | Exceptional 11.9% |
| Immigrants | Russia | 99.6 /100 | #69 | Exceptional 11.9% |
| Immigrants | Nepal | 99.6 /100 | #70 | Exceptional 11.9% |
| Immigrants | Greece | 99.6 /100 | #71 | Exceptional 11.9% |
| Immigrants | Argentina | 99.5 /100 | #72 | Exceptional 11.9% |
| Argentineans | 99.5 /100 | #73 | Exceptional 11.9% |
| Chileans | 99.5 /100 | #74 | Exceptional 11.9% |
| Uruguayans | 99.4 /100 | #75 | Exceptional 11.9% |
| Immigrants | Northern Africa | 99.4 /100 | #76 | Exceptional 11.9% |
| Immigrants | Malaysia | 99.2 /100 | #77 | Exceptional 12.0% |
| Immigrants | Venezuela | 99.1 /100 | #78 | Exceptional 12.0% |
| Immigrants | Belgium | 99.0 /100 | #79 | Exceptional 12.0% |
| Armenians | 98.7 /100 | #80 | Exceptional 12.1% |
Demographics Similar to Hispanics or Latinos by Single Male Poverty
In terms of single male poverty, the demographic groups most similar to Hispanics or Latinos are Hmong (14.2%, a difference of 0.030%), Spanish American (14.2%, a difference of 0.16%), Yaqui (14.2%, a difference of 0.32%), Indonesian (14.1%, a difference of 0.73%), and Slovak (14.1%, a difference of 0.77%).
| Demographics | Rating | Rank | Single Male Poverty |
| Hondurans | 0.1 /100 | #274 | Tragic 14.0% |
| English | 0.1 /100 | #275 | Tragic 14.1% |
| Dutch | 0.1 /100 | #276 | Tragic 14.1% |
| Immigrants | Honduras | 0.0 /100 | #277 | Tragic 14.1% |
| Slovaks | 0.0 /100 | #278 | Tragic 14.1% |
| Indonesians | 0.0 /100 | #279 | Tragic 14.1% |
| Hmong | 0.0 /100 | #280 | Tragic 14.2% |
| Hispanics or Latinos | 0.0 /100 | #281 | Tragic 14.2% |
| Spanish Americans | 0.0 /100 | #282 | Tragic 14.2% |
| Yaqui | 0.0 /100 | #283 | Tragic 14.2% |
| Immigrants | Bahamas | 0.0 /100 | #284 | Tragic 14.4% |
| French | 0.0 /100 | #285 | Tragic 14.4% |
| Celtics | 0.0 /100 | #286 | Tragic 14.5% |
| Iroquois | 0.0 /100 | #287 | Tragic 14.5% |
| Whites/Caucasians | 0.0 /100 | #288 | Tragic 14.5% |