Arapaho vs Immigrants from Nigeria Single Male Poverty
COMPARE
Arapaho
Immigrants from Nigeria
Single Male Poverty
Single Male Poverty Comparison
Arapaho
Immigrants from Nigeria
21.9%
SINGLE MALE POVERTY
0.0/ 100
METRIC RATING
339th/ 347
METRIC RANK
12.7%
SINGLE MALE POVERTY
62.8/ 100
METRIC RATING
164th/ 347
METRIC RANK
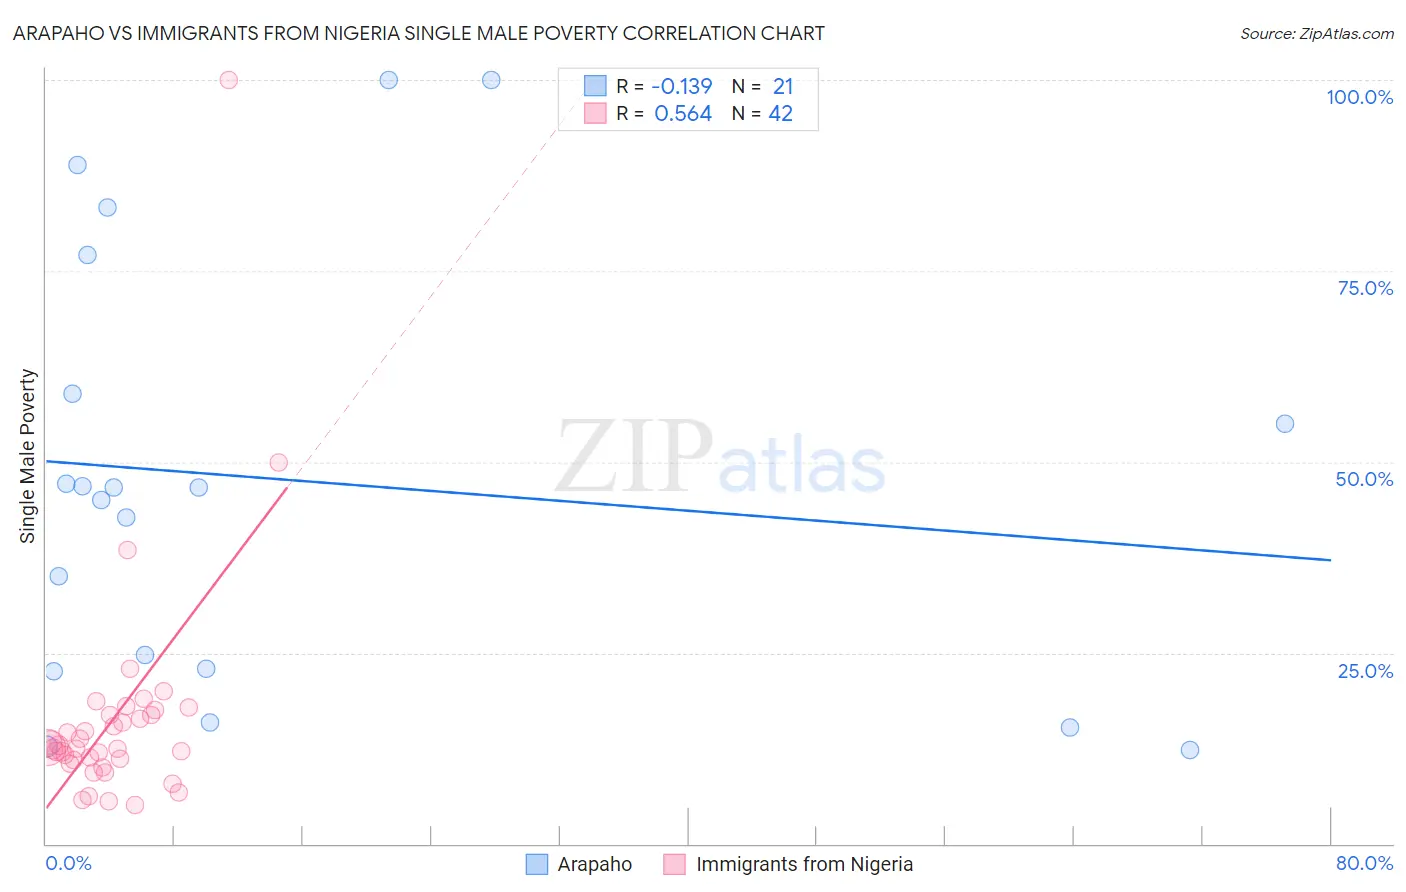
Arapaho vs Immigrants from Nigeria Single Male Poverty Correlation Chart
The statistical analysis conducted on geographies consisting of 29,002,421 people shows a poor negative correlation between the proportion of Arapaho and poverty level among single males in the United States with a correlation coefficient (R) of -0.139 and weighted average of 21.9%. Similarly, the statistical analysis conducted on geographies consisting of 260,626,555 people shows a substantial positive correlation between the proportion of Immigrants from Nigeria and poverty level among single males in the United States with a correlation coefficient (R) of 0.564 and weighted average of 12.7%, a difference of 72.6%.
Single Male Poverty Correlation Summary
| Measurement | Arapaho | Immigrants from Nigeria |
| Minimum | 12.3% | 5.0% |
| Maximum | 100.0% | 100.0% |
| Range | 87.7% | 95.0% |
| Mean | 47.6% | 16.5% |
| Median | 46.6% | 12.5% |
| Interquartile 25% (IQ1) | 22.7% | 10.9% |
| Interquartile 75% (IQ3) | 68.0% | 16.9% |
| Interquartile Range (IQR) | 45.3% | 6.0% |
| Standard Deviation (Sample) | 28.3% | 15.4% |
| Standard Deviation (Population) | 27.6% | 15.2% |
Similar Demographics by Single Male Poverty
Demographics Similar to Arapaho by Single Male Poverty
In terms of single male poverty, the demographic groups most similar to Arapaho are Sioux (22.2%, a difference of 1.3%), Pueblo (21.6%, a difference of 1.5%), Apache (21.6%, a difference of 1.7%), Tohono O'odham (21.6%, a difference of 1.8%), and Yuman (21.3%, a difference of 3.0%).
| Demographics | Rating | Rank | Single Male Poverty |
| Natives/Alaskans | 0.0 /100 | #332 | Tragic 19.6% |
| Inupiat | 0.0 /100 | #333 | Tragic 20.0% |
| Pima | 0.0 /100 | #334 | Tragic 20.2% |
| Yuman | 0.0 /100 | #335 | Tragic 21.3% |
| Tohono O'odham | 0.0 /100 | #336 | Tragic 21.6% |
| Apache | 0.0 /100 | #337 | Tragic 21.6% |
| Pueblo | 0.0 /100 | #338 | Tragic 21.6% |
| Arapaho | 0.0 /100 | #339 | Tragic 21.9% |
| Sioux | 0.0 /100 | #340 | Tragic 22.2% |
| Crow | 0.0 /100 | #341 | Tragic 23.3% |
| Houma | 0.0 /100 | #342 | Tragic 23.5% |
| Puerto Ricans | 0.0 /100 | #343 | Tragic 25.1% |
| Lumbee | 0.0 /100 | #344 | Tragic 25.2% |
| Navajo | 0.0 /100 | #345 | Tragic 25.3% |
| Hopi | 0.0 /100 | #346 | Tragic 27.5% |
Demographics Similar to Immigrants from Nigeria by Single Male Poverty
In terms of single male poverty, the demographic groups most similar to Immigrants from Nigeria are Palestinian (12.7%, a difference of 0.010%), Eastern European (12.7%, a difference of 0.020%), Immigrants from Africa (12.7%, a difference of 0.030%), Immigrants from Cambodia (12.7%, a difference of 0.040%), and Greek (12.7%, a difference of 0.070%).
| Demographics | Rating | Rank | Single Male Poverty |
| Latvians | 67.9 /100 | #157 | Good 12.7% |
| Immigrants | Middle Africa | 64.9 /100 | #158 | Good 12.7% |
| Immigrants | Liberia | 64.2 /100 | #159 | Good 12.7% |
| Greeks | 64.1 /100 | #160 | Good 12.7% |
| Immigrants | Africa | 63.4 /100 | #161 | Good 12.7% |
| Eastern Europeans | 63.3 /100 | #162 | Good 12.7% |
| Palestinians | 63.1 /100 | #163 | Good 12.7% |
| Immigrants | Nigeria | 62.8 /100 | #164 | Good 12.7% |
| Immigrants | Cambodia | 62.2 /100 | #165 | Good 12.7% |
| Immigrants | Guyana | 60.5 /100 | #166 | Good 12.7% |
| Immigrants | Sudan | 58.2 /100 | #167 | Average 12.7% |
| Immigrants | Barbados | 57.7 /100 | #168 | Average 12.7% |
| Puget Sound Salish | 54.3 /100 | #169 | Average 12.8% |
| Guyanese | 52.0 /100 | #170 | Average 12.8% |
| South Africans | 51.5 /100 | #171 | Average 12.8% |