Arapaho vs Immigrants from Burma/Myanmar Single Male Poverty

COMPARE

Arapaho
Race
Ancestry
AfghanAfricanAlaska NativeAlaskan AthabascanAlbanianAleutAlsatianAmericanApacheArabArapahoArgentineanArmenianAssyrian/Chaldean/SyriacAustralianAustrianBahamianBangladeshiBarbadianBasqueBelgianBelizeanBermudanBhutaneseBlackfeetBolivianBrazilianBritishBritish West IndianBulgarianBurmeseCajunCambodianCanadianCape VerdeanCarpatho RusynCelticCentral AmericanCentral American IndianCherokeeCheyenneChickasawChileanChineseChippewaChoctawColombianColvilleComancheCosta RicanCreeCreekCroatianCrowCubanCypriotCzechCzechoslovakianDanishDelawareDominicanDutchDutch West IndianEastern EuropeanEcuadorianEgyptianEnglishEstonianEthiopianEuropeanFijianFilipinoFinnishFrenchFrench American IndianFrench CanadianGermanGerman RussianGhanaianGreekGuamanian/ChamorroGuatemalanGuyaneseHaitianHmongHonduranHopiHoumaHungarianIcelanderIndian (Asian)IndonesianInupiatIranianIraqiIrishIroquoisIsraeliItalianJamaicanJapaneseJordanianKenyanKiowaKoreanLaotianLatvianLebaneseLiberianLithuanianLumbeeLuxembourgerMacedonianMalaysianMalteseMarshalleseMenomineeMexicanMexican American IndianMongolianMoroccanNative HawaiianNavajoNepaleseNew ZealanderNicaraguanNigerianNorthern EuropeanNorwegianOkinawanOsageOttawaPaiutePakistaniPalestinianPanamanianParaguayanPennsylvania GermanPeruvianPimaPolishPortuguesePotawatomiPuebloPuerto RicanPuget Sound SalishRomanianRussianSalvadoranSamoanScandinavianScotch-IrishScottishSeminoleSenegaleseSerbianShoshoneSierra LeoneanSiouxSlavicSlovakSloveneSomaliSouth AfricanSouth AmericanSouth American IndianSoviet UnionSpaniardSpanishSpanish AmericanSpanish American IndianSri LankanSubsaharan AfricanSudaneseSwedishSwissSyrianTaiwaneseThaiTlingit-HaidaTohono O'OdhamTonganTrinidadian and TobagonianTsimshianTurkishU.S. Virgin IslanderUgandanUkrainianUruguayanUteVenezuelanVietnameseWelshWest IndianYakamaYaquiYugoslavianYumanYup'ikZimbabwean
Immigration
NonimmigrantsImmigrantsAfghanistanAfricaAlbaniaArgentinaArmeniaAsiaAustraliaAustriaBahamasBangladeshBarbadosBelarusBelgiumBelizeBoliviaBosnia and HerzegovinaBrazilBulgariaCabo VerdeCambodiaCameroonCanadaCaribbeanCentral AmericaChileChinaColombiaCongoCosta RicaCroatiaCubaCzechoslovakiaDenmarkDominicaDominican RepublicEastern AfricaEastern AsiaEastern EuropeEcuadorEgyptEl SalvadorEnglandEritreaEthiopiaEuropeFijiFranceGermanyGhanaGreeceGrenadaGuatemalaGuyanaHaitiHondurasHong KongHungaryIndiaIndonesiaIranIraqIrelandIsraelItalyJamaicaJapanJordanKazakhstanKenyaKoreaKuwaitLaosLatin AmericaLatviaLebanonLiberiaLithuaniaMalaysiaMexicoMicronesiaMiddle AfricaMoldovaMoroccoNepalNetherlandsNicaraguaNigeriaNorth AmericaNorth MacedoniaNorthern AfricaNorthern EuropeNorwayOceaniaPakistanPanamaPeruPhilippinesPolandPortugalRomaniaRussiaSaudi ArabiaScotlandSenegalSerbiaSierra LeoneSingaporeSomaliaSouth AfricaSouth AmericaSouth Central AsiaSouth Eastern AsiaSouthern EuropeSpainSri LankaSt. Vincent and the GrenadinesSudanSwedenSwitzerlandSyriaTaiwanThailandTrinidad and TobagoTurkeyUgandaUkraineUruguayUzbekistanVenezuelaVietnamWest IndiesWestern AfricaWestern AsiaWestern EuropeYemenZaireZimbabweAzores
Immigrants from Burma/Myanmar
Race
Ancestry
AfghanAfricanAlaska NativeAlaskan AthabascanAlbanianAleutAlsatianAmericanApacheArabArgentineanArmenianAssyrian/Chaldean/SyriacAustralianAustrianBahamianBangladeshiBarbadianBasqueBelgianBelizeanBermudanBhutaneseBlackfeetBolivianBrazilianBritishBritish West IndianBulgarianBurmeseCajunCambodianCanadianCape VerdeanCarpatho RusynCelticCentral AmericanCentral American IndianCherokeeCheyenneChickasawChileanChineseChippewaChoctawColombianColvilleComancheCosta RicanCreeCreekCroatianCrowCubanCypriotCzechCzechoslovakianDanishDelawareDominicanDutchDutch West IndianEastern EuropeanEcuadorianEgyptianEnglishEstonianEthiopianEuropeanFijianFilipinoFinnishFrenchFrench American IndianFrench CanadianGermanGerman RussianGhanaianGreekGuamanian/ChamorroGuatemalanGuyaneseHaitianHmongHonduranHopiHoumaHungarianIcelanderIndian (Asian)IndonesianInupiatIranianIraqiIrishIroquoisIsraeliItalianJamaicanJapaneseJordanianKenyanKiowaKoreanLaotianLatvianLebaneseLiberianLithuanianLumbeeLuxembourgerMacedonianMalaysianMalteseMarshalleseMenomineeMexicanMexican American IndianMongolianMoroccanNative HawaiianNavajoNepaleseNew ZealanderNicaraguanNigerianNorthern EuropeanNorwegianOkinawanOsageOttawaPaiutePakistaniPalestinianPanamanianParaguayanPennsylvania GermanPeruvianPimaPolishPortuguesePotawatomiPuebloPuerto RicanPuget Sound SalishRomanianRussianSalvadoranSamoanScandinavianScotch-IrishScottishSeminoleSenegaleseSerbianShoshoneSierra LeoneanSiouxSlavicSlovakSloveneSomaliSouth AfricanSouth AmericanSouth American IndianSoviet UnionSpaniardSpanishSpanish AmericanSpanish American IndianSri LankanSubsaharan AfricanSudaneseSwedishSwissSyrianTaiwaneseThaiTlingit-HaidaTohono O'OdhamTonganTrinidadian and TobagonianTsimshianTurkishU.S. Virgin IslanderUgandanUkrainianUruguayanUteVenezuelanVietnameseWelshWest IndianYakamaYaquiYugoslavianYumanYup'ikZimbabwean
Immigration
NonimmigrantsImmigrantsAfghanistanAfricaAlbaniaArgentinaArmeniaAsiaAustraliaAustriaBahamasBangladeshBarbadosBelarusBelgiumBelizeBoliviaBosnia and HerzegovinaBrazilBulgariaBurma/MyanmarCabo VerdeCambodiaCameroonCanadaCaribbeanCentral AmericaChileChinaColombiaCongoCosta RicaCroatiaCubaCzechoslovakiaDenmarkDominicaDominican RepublicEastern AfricaEastern AsiaEastern EuropeEcuadorEgyptEl SalvadorEnglandEritreaEthiopiaEuropeFijiFranceGermanyGhanaGreeceGrenadaGuatemalaGuyanaHaitiHondurasHong KongHungaryIndiaIndonesiaIranIraqIrelandIsraelItalyJamaicaJapanJordanKazakhstanKenyaKoreaKuwaitLaosLatin AmericaLatviaLebanonLiberiaLithuaniaMalaysiaMexicoMicronesiaMiddle AfricaMoldovaMoroccoNepalNetherlandsNicaraguaNigeriaNorth AmericaNorth MacedoniaNorthern AfricaNorthern EuropeNorwayOceaniaPakistanPanamaPeruPhilippinesPolandPortugalRomaniaRussiaSaudi ArabiaScotlandSenegalSerbiaSierra LeoneSingaporeSomaliaSouth AfricaSouth AmericaSouth Central AsiaSouth Eastern AsiaSouthern EuropeSpainSri LankaSt. Vincent and the GrenadinesSudanSwedenSwitzerlandSyriaTaiwanThailandTrinidad and TobagoTurkeyUgandaUkraineUruguayUzbekistanVenezuelaVietnamWest IndiesWestern AfricaWestern AsiaWestern EuropeYemenZaireZimbabweAzores
Single Male Poverty
Income
Poverty
Unemployment
Labor Participation
Family Structure
Vehicle Availability
Education Level
Disability

Single Male Poverty Comparison

Arapaho

Immigrants from Burma/Myanmar

Tragic
Poor
21.9%
SINGLE MALE POVERTY
0.0/ 100
METRIC RATING
339th/ 347
METRIC RANK
13.1%
SINGLE MALE POVERTY
12.6/ 100
METRIC RATING
219th/ 347
METRIC RANK

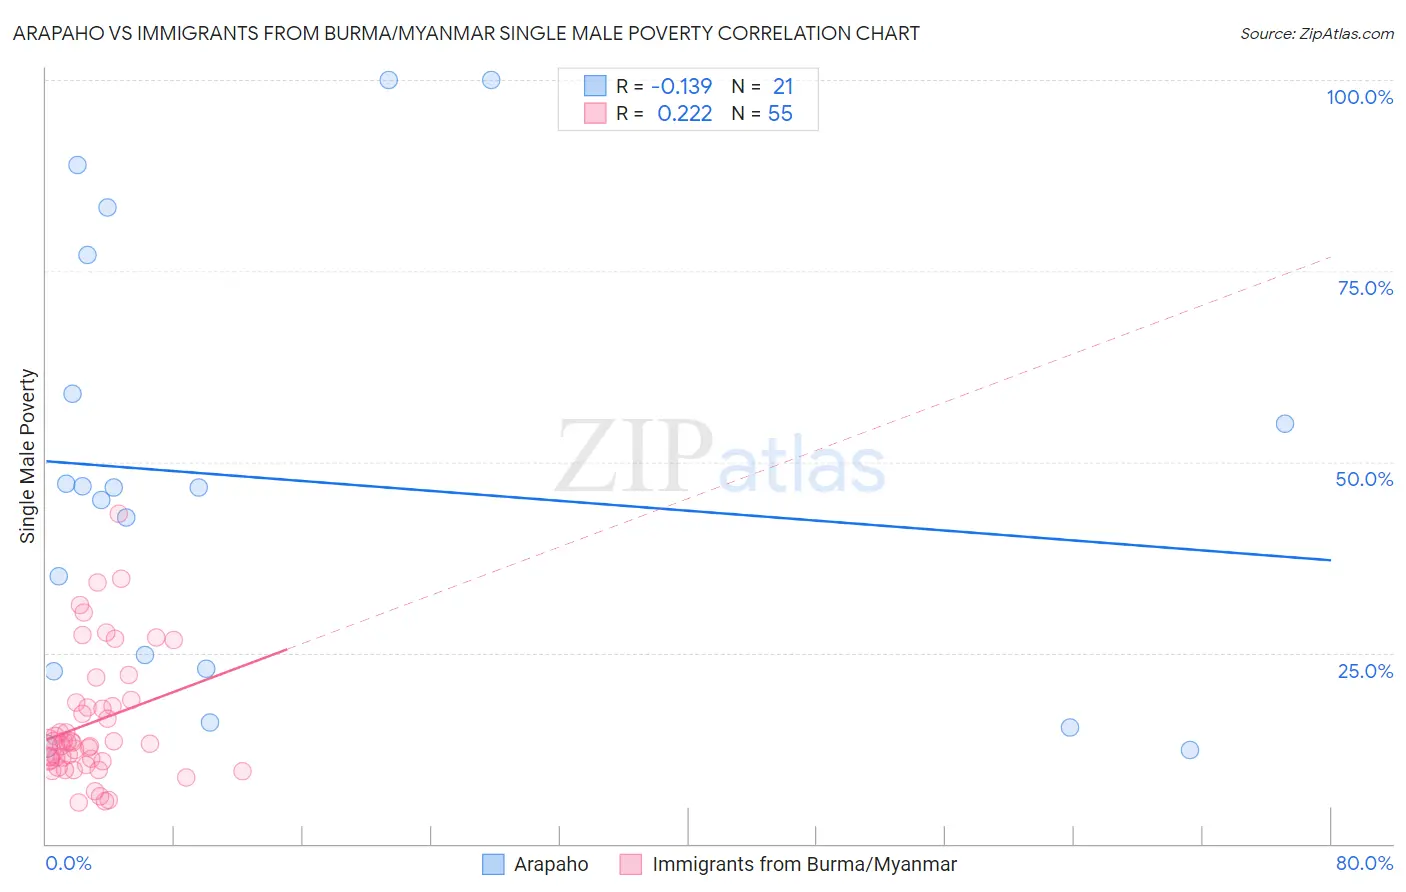
Arapaho vs Immigrants from Burma/Myanmar Single Male Poverty Correlation Chart

The statistical analysis conducted on geographies consisting of 29,002,421 people shows a poor negative correlation between the proportion of Arapaho and poverty level among single males in the United States with a correlation coefficient (R) of -0.139 and weighted average of 21.9%. Similarly, the statistical analysis conducted on geographies consisting of 162,611,210 people shows a weak positive correlation between the proportion of Immigrants from Burma/Myanmar and poverty level among single males in the United States with a correlation coefficient (R) of 0.222 and weighted average of 13.1%, a difference of 67.1%.
Arapaho vs Immigrants from Burma/Myanmar Single Male Poverty

Single Male Poverty Correlation Summary

MeasurementArapahoImmigrants from Burma/Myanmar
Minimum12.3%5.4%
Maximum100.0%43.1%
Range87.7%37.7%
Mean47.6%15.9%
Median46.6%13.3%
Interquartile 25% (IQ1)22.7%10.8%
Interquartile 75% (IQ3)68.0%18.5%
Interquartile Range (IQR)45.3%7.8%
Standard Deviation (Sample)28.3%8.3%
Standard Deviation (Population)27.6%8.2%

Similar Demographics by Single Male Poverty

Demographics Similar to Arapaho by Single Male Poverty

In terms of single male poverty, the demographic groups most similar to Arapaho are Sioux (22.2%, a difference of 1.3%), Pueblo (21.6%, a difference of 1.5%), Apache (21.6%, a difference of 1.7%), Tohono O'odham (21.6%, a difference of 1.8%), and Yuman (21.3%, a difference of 3.0%).
DemographicsRating | RankSingle Male Poverty
Natives/Alaskans
0.0
/100
|
#332
Tragic
19.6%
Inupiat
0.0
/100
|
#333
Tragic
20.0%
Pima
0.0
/100
|
#334
Tragic
20.2%
Yuman
0.0
/100
|
#335
Tragic
21.3%
Tohono O'odham
0.0
/100
|
#336
Tragic
21.6%
Apache
0.0
/100
|
#337
Tragic
21.6%
Pueblo
0.0
/100
|
#338
Tragic
21.6%
Arapaho
0.0
/100
|
#339
Tragic
21.9%
Sioux
0.0
/100
|
#340
Tragic
22.2%
Crow
0.0
/100
|
#341
Tragic
23.3%
Houma
0.0
/100
|
#342
Tragic
23.5%
Puerto Ricans
0.0
/100
|
#343
Tragic
25.1%
Lumbee
0.0
/100
|
#344
Tragic
25.2%
Navajo
0.0
/100
|
#345
Tragic
25.3%
Hopi
0.0
/100
|
#346
Tragic
27.5%

Demographics Similar to Immigrants from Burma/Myanmar by Single Male Poverty

In terms of single male poverty, the demographic groups most similar to Immigrants from Burma/Myanmar are Scandinavian (13.1%, a difference of 0.030%), Bermudan (13.1%, a difference of 0.050%), Austrian (13.1%, a difference of 0.15%), Central American (13.2%, a difference of 0.22%), and Japanese (13.1%, a difference of 0.24%).
DemographicsRating | RankSingle Male Poverty
Senegalese
16.4
/100
|
#212
Poor
13.1%
Italians
15.9
/100
|
#213
Poor
13.1%
Zimbabweans
14.9
/100
|
#214
Poor
13.1%
Japanese
14.8
/100
|
#215
Poor
13.1%
Austrians
13.9
/100
|
#216
Poor
13.1%
Bermudans
13.0
/100
|
#217
Poor
13.1%
Scandinavians
12.9
/100
|
#218
Poor
13.1%
Immigrants | Burma/Myanmar
12.6
/100
|
#219
Poor
13.1%
Central Americans
10.9
/100
|
#220
Poor
13.2%
New Zealanders
10.7
/100
|
#221
Poor
13.2%
Immigrants | Western Europe
10.0
/100
|
#222
Poor
13.2%
Immigrants | Azores
9.3
/100
|
#223
Tragic
13.2%
Somalis
9.1
/100
|
#224
Tragic
13.2%
Immigrants | Denmark
8.7
/100
|
#225
Tragic
13.2%
Jamaicans
7.7
/100
|
#226
Tragic
13.2%