Arab vs Turkish Single Mother Poverty
COMPARE
Arab
Turkish
Single Mother Poverty
Single Mother Poverty Comparison
Arabs
Turks
29.0%
SINGLE MOTHER POVERTY
60.7/ 100
METRIC RATING
165th/ 347
METRIC RANK
26.4%
SINGLE MOTHER POVERTY
100.0/ 100
METRIC RATING
30th/ 347
METRIC RANK
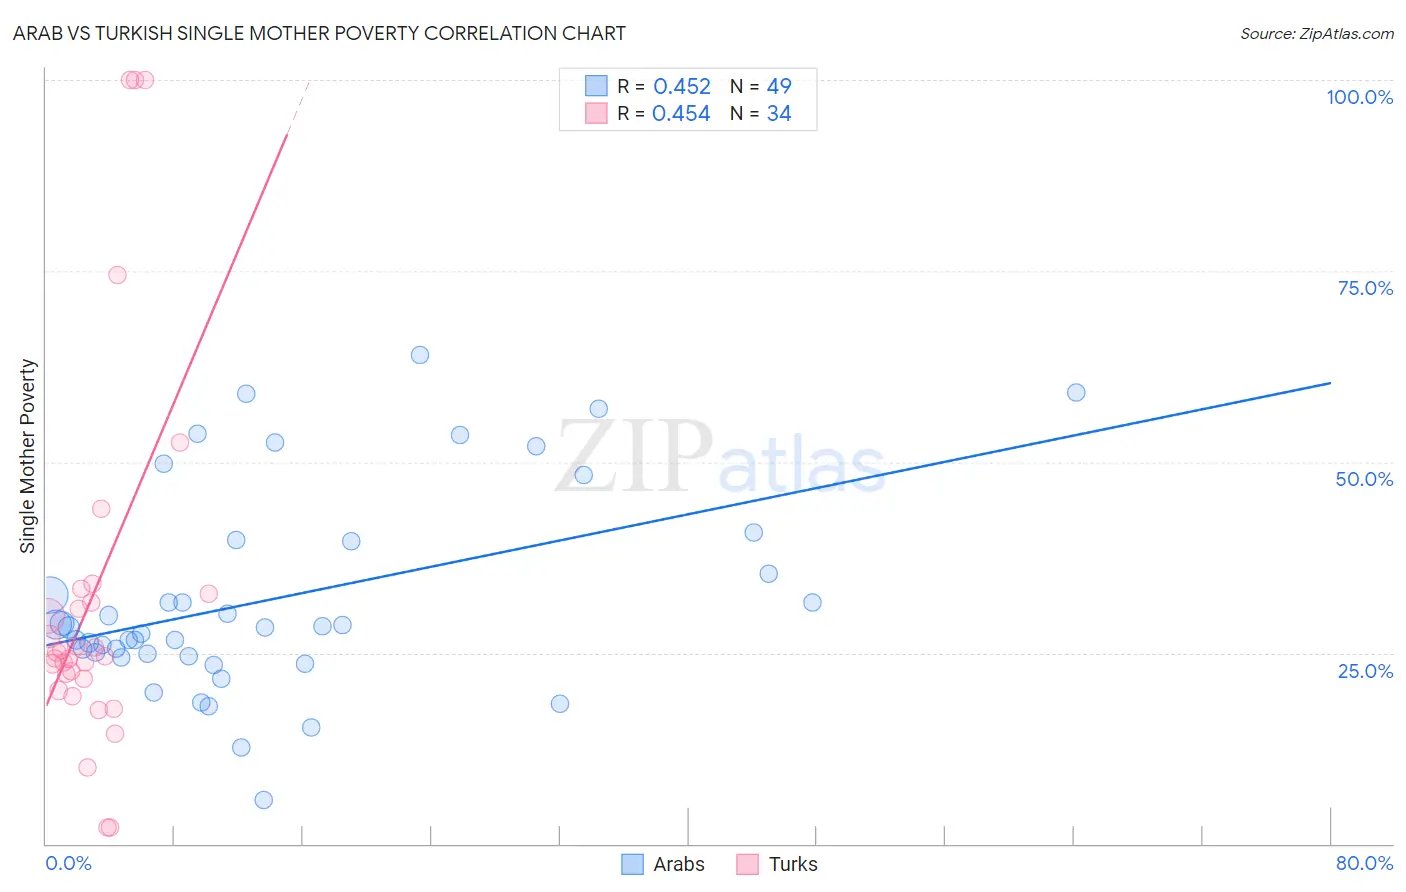
Arab vs Turkish Single Mother Poverty Correlation Chart
The statistical analysis conducted on geographies consisting of 470,668,307 people shows a moderate positive correlation between the proportion of Arabs and poverty level among single mothers in the United States with a correlation coefficient (R) of 0.452 and weighted average of 29.0%. Similarly, the statistical analysis conducted on geographies consisting of 265,895,030 people shows a moderate positive correlation between the proportion of Turks and poverty level among single mothers in the United States with a correlation coefficient (R) of 0.454 and weighted average of 26.4%, a difference of 9.8%.
Single Mother Poverty Correlation Summary
| Measurement | Arab | Turkish |
| Minimum | 5.8% | 2.2% |
| Maximum | 63.9% | 100.0% |
| Range | 58.1% | 97.8% |
| Mean | 32.2% | 32.5% |
| Median | 28.4% | 24.8% |
| Interquartile 25% (IQ1) | 24.8% | 21.6% |
| Interquartile 75% (IQ3) | 39.7% | 32.8% |
| Interquartile Range (IQR) | 14.9% | 11.2% |
| Standard Deviation (Sample) | 13.3% | 24.9% |
| Standard Deviation (Population) | 13.2% | 24.5% |
Similar Demographics by Single Mother Poverty
Demographics Similar to Arabs by Single Mother Poverty
In terms of single mother poverty, the demographic groups most similar to Arabs are Inupiat (29.0%, a difference of 0.020%), Costa Rican (29.0%, a difference of 0.12%), European (29.1%, a difference of 0.16%), Immigrants from Uruguay (29.1%, a difference of 0.17%), and Immigrants from Nigeria (28.9%, a difference of 0.27%).
| Demographics | Rating | Rank | Single Mother Poverty |
| Immigrants | Hungary | 70.6 /100 | #158 | Good 28.9% |
| Czechs | 68.4 /100 | #159 | Good 28.9% |
| Japanese | 68.0 /100 | #160 | Good 28.9% |
| Immigrants | Cambodia | 66.6 /100 | #161 | Good 28.9% |
| Scandinavians | 66.2 /100 | #162 | Good 28.9% |
| Immigrants | Nigeria | 65.9 /100 | #163 | Good 28.9% |
| Immigrants | Kenya | 65.9 /100 | #164 | Good 28.9% |
| Arabs | 60.7 /100 | #165 | Good 29.0% |
| Inupiat | 60.4 /100 | #166 | Good 29.0% |
| Costa Ricans | 58.4 /100 | #167 | Average 29.0% |
| Europeans | 57.6 /100 | #168 | Average 29.1% |
| Immigrants | Uruguay | 57.2 /100 | #169 | Average 29.1% |
| New Zealanders | 55.1 /100 | #170 | Average 29.1% |
| Puget Sound Salish | 55.1 /100 | #171 | Average 29.1% |
| Carpatho Rusyns | 53.8 /100 | #172 | Average 29.1% |
Demographics Similar to Turks by Single Mother Poverty
In terms of single mother poverty, the demographic groups most similar to Turks are Jordanian (26.4%, a difference of 0.090%), Korean (26.4%, a difference of 0.14%), Immigrants from Japan (26.4%, a difference of 0.15%), Immigrants from Philippines (26.5%, a difference of 0.16%), and Immigrants from Sri Lanka (26.3%, a difference of 0.38%).
| Demographics | Rating | Rank | Single Mother Poverty |
| Burmese | 100.0 /100 | #23 | Exceptional 26.2% |
| Immigrants | Moldova | 100.0 /100 | #24 | Exceptional 26.2% |
| Immigrants | Asia | 100.0 /100 | #25 | Exceptional 26.3% |
| Immigrants | Sri Lanka | 100.0 /100 | #26 | Exceptional 26.3% |
| Immigrants | Japan | 100.0 /100 | #27 | Exceptional 26.4% |
| Koreans | 100.0 /100 | #28 | Exceptional 26.4% |
| Jordanians | 100.0 /100 | #29 | Exceptional 26.4% |
| Turks | 100.0 /100 | #30 | Exceptional 26.4% |
| Immigrants | Philippines | 100.0 /100 | #31 | Exceptional 26.5% |
| Tongans | 99.9 /100 | #32 | Exceptional 26.5% |
| Bulgarians | 99.9 /100 | #33 | Exceptional 26.5% |
| Immigrants | Indonesia | 99.9 /100 | #34 | Exceptional 26.6% |
| Maltese | 99.9 /100 | #35 | Exceptional 26.6% |
| Okinawans | 99.9 /100 | #36 | Exceptional 26.6% |
| Immigrants | Israel | 99.9 /100 | #37 | Exceptional 26.6% |