Arab vs Ghanaian Single Mother Poverty
COMPARE
Arab
Ghanaian
Single Mother Poverty
Single Mother Poverty Comparison
Arabs
Ghanaians
29.0%
SINGLE MOTHER POVERTY
60.7/ 100
METRIC RATING
165th/ 347
METRIC RANK
29.4%
SINGLE MOTHER POVERTY
36.8/ 100
METRIC RATING
185th/ 347
METRIC RANK
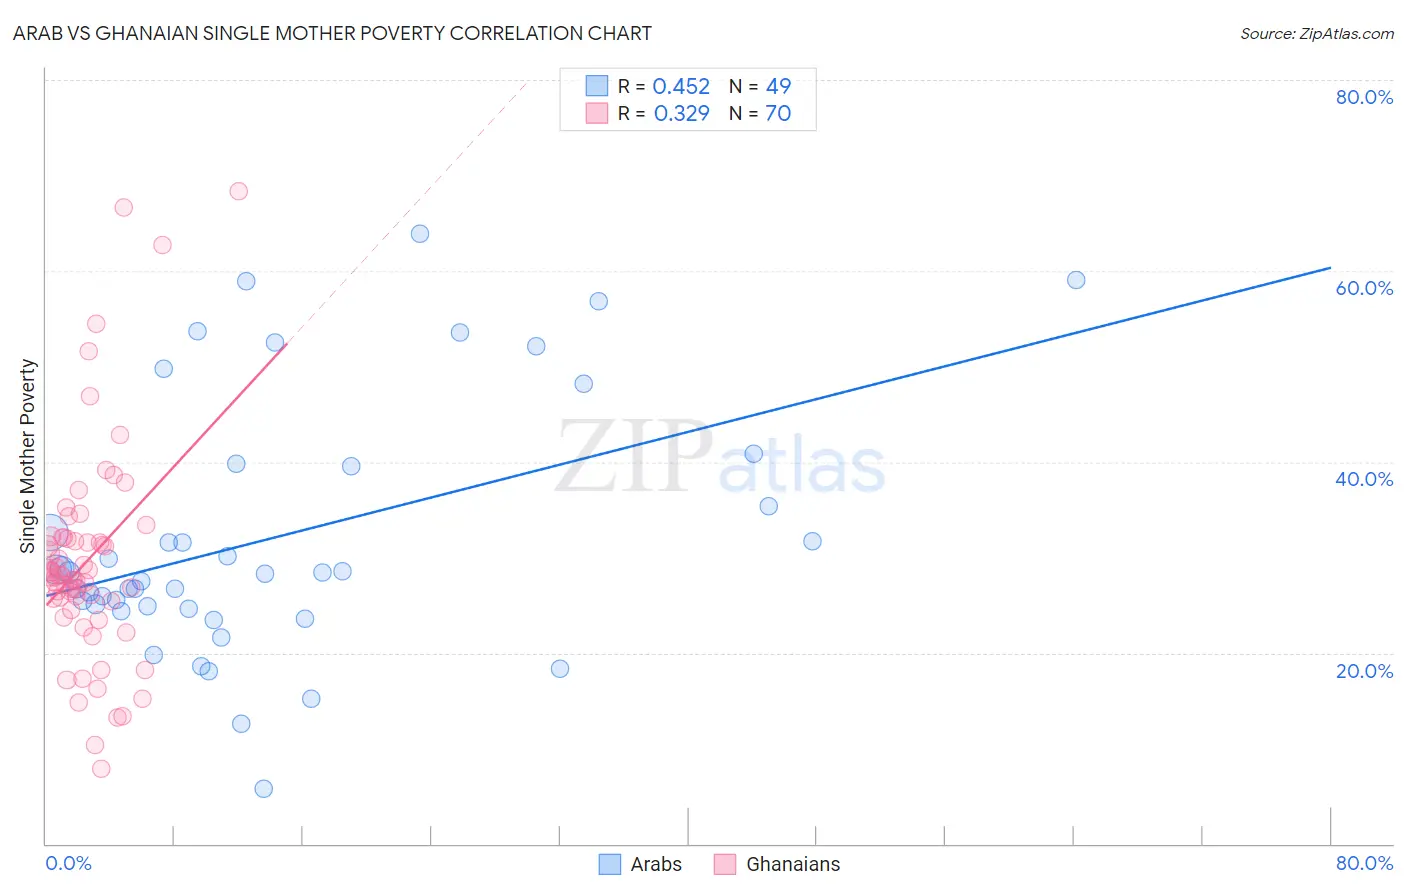
Arab vs Ghanaian Single Mother Poverty Correlation Chart
The statistical analysis conducted on geographies consisting of 470,668,307 people shows a moderate positive correlation between the proportion of Arabs and poverty level among single mothers in the United States with a correlation coefficient (R) of 0.452 and weighted average of 29.0%. Similarly, the statistical analysis conducted on geographies consisting of 188,697,723 people shows a mild positive correlation between the proportion of Ghanaians and poverty level among single mothers in the United States with a correlation coefficient (R) of 0.329 and weighted average of 29.4%, a difference of 1.2%.
Single Mother Poverty Correlation Summary
| Measurement | Arab | Ghanaian |
| Minimum | 5.8% | 7.9% |
| Maximum | 63.9% | 68.3% |
| Range | 58.1% | 60.4% |
| Mean | 32.2% | 29.6% |
| Median | 28.4% | 28.0% |
| Interquartile 25% (IQ1) | 24.8% | 25.4% |
| Interquartile 75% (IQ3) | 39.7% | 32.0% |
| Interquartile Range (IQR) | 14.9% | 6.6% |
| Standard Deviation (Sample) | 13.3% | 11.4% |
| Standard Deviation (Population) | 13.2% | 11.3% |
Demographics Similar to Arabs and Ghanaians by Single Mother Poverty
In terms of single mother poverty, the demographic groups most similar to Arabs are Inupiat (29.0%, a difference of 0.020%), Costa Rican (29.0%, a difference of 0.12%), European (29.1%, a difference of 0.16%), Immigrants from Uruguay (29.1%, a difference of 0.17%), and New Zealander (29.1%, a difference of 0.27%). Similarly, the demographic groups most similar to Ghanaians are Nigerian (29.3%, a difference of 0.060%), Nepalese (29.3%, a difference of 0.070%), Immigrants from Eastern Africa (29.3%, a difference of 0.090%), Canadian (29.3%, a difference of 0.18%), and Immigrants from Norway (29.3%, a difference of 0.23%).
| Demographics | Rating | Rank | Single Mother Poverty |
| Arabs | 60.7 /100 | #165 | Good 29.0% |
| Inupiat | 60.4 /100 | #166 | Good 29.0% |
| Costa Ricans | 58.4 /100 | #167 | Average 29.0% |
| Europeans | 57.6 /100 | #168 | Average 29.1% |
| Immigrants | Uruguay | 57.2 /100 | #169 | Average 29.1% |
| New Zealanders | 55.1 /100 | #170 | Average 29.1% |
| Puget Sound Salish | 55.1 /100 | #171 | Average 29.1% |
| Carpatho Rusyns | 53.8 /100 | #172 | Average 29.1% |
| British | 50.6 /100 | #173 | Average 29.2% |
| Immigrants | Saudi Arabia | 50.0 /100 | #174 | Average 29.2% |
| Immigrants | Costa Rica | 48.8 /100 | #175 | Average 29.2% |
| Hawaiians | 47.8 /100 | #176 | Average 29.2% |
| Immigrants | Bosnia and Herzegovina | 45.1 /100 | #177 | Average 29.2% |
| South American Indians | 43.2 /100 | #178 | Average 29.3% |
| Immigrants | Uzbekistan | 42.6 /100 | #179 | Average 29.3% |
| Immigrants | Norway | 41.5 /100 | #180 | Average 29.3% |
| Canadians | 40.4 /100 | #181 | Average 29.3% |
| Immigrants | Eastern Africa | 38.5 /100 | #182 | Fair 29.3% |
| Nepalese | 38.3 /100 | #183 | Fair 29.3% |
| Nigerians | 38.0 /100 | #184 | Fair 29.3% |
| Ghanaians | 36.8 /100 | #185 | Fair 29.4% |