Arab vs Spanish American Single Mother Poverty
COMPARE
Arab
Spanish American
Single Mother Poverty
Single Mother Poverty Comparison
Arabs
Spanish Americans
29.0%
SINGLE MOTHER POVERTY
60.7/ 100
METRIC RATING
165th/ 347
METRIC RANK
32.3%
SINGLE MOTHER POVERTY
0.0/ 100
METRIC RATING
283rd/ 347
METRIC RANK
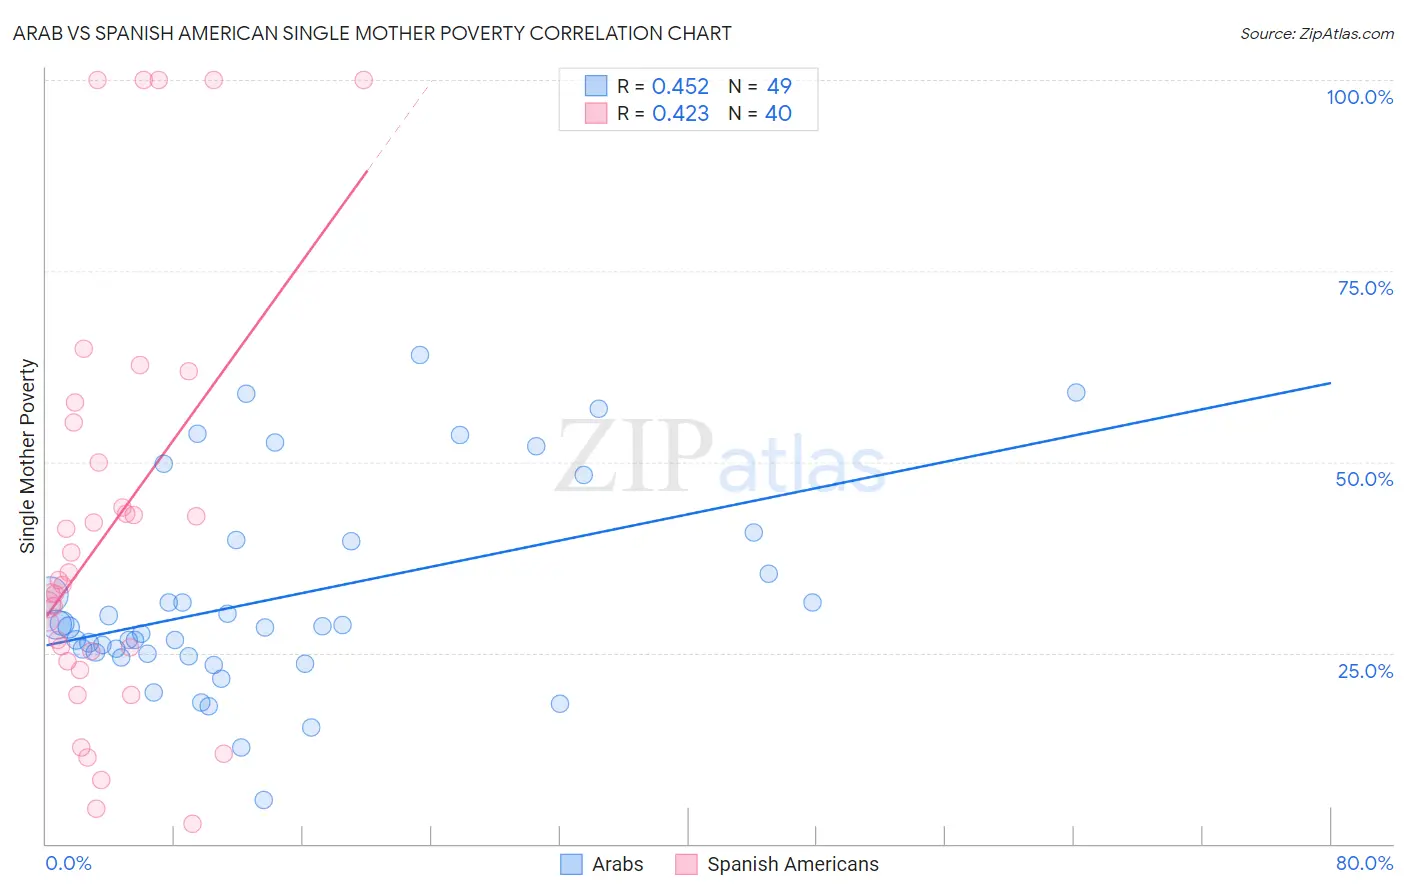
Arab vs Spanish American Single Mother Poverty Correlation Chart
The statistical analysis conducted on geographies consisting of 470,668,307 people shows a moderate positive correlation between the proportion of Arabs and poverty level among single mothers in the United States with a correlation coefficient (R) of 0.452 and weighted average of 29.0%. Similarly, the statistical analysis conducted on geographies consisting of 102,717,575 people shows a moderate positive correlation between the proportion of Spanish Americans and poverty level among single mothers in the United States with a correlation coefficient (R) of 0.423 and weighted average of 32.3%, a difference of 11.3%.
Single Mother Poverty Correlation Summary
| Measurement | Arab | Spanish American |
| Minimum | 5.8% | 2.6% |
| Maximum | 63.9% | 100.0% |
| Range | 58.1% | 97.4% |
| Mean | 32.2% | 41.2% |
| Median | 28.4% | 34.2% |
| Interquartile 25% (IQ1) | 24.8% | 24.5% |
| Interquartile 75% (IQ3) | 39.7% | 52.6% |
| Interquartile Range (IQR) | 14.9% | 28.0% |
| Standard Deviation (Sample) | 13.3% | 27.2% |
| Standard Deviation (Population) | 13.2% | 26.9% |
Similar Demographics by Single Mother Poverty
Demographics Similar to Arabs by Single Mother Poverty
In terms of single mother poverty, the demographic groups most similar to Arabs are Inupiat (29.0%, a difference of 0.020%), Costa Rican (29.0%, a difference of 0.12%), European (29.1%, a difference of 0.16%), Immigrants from Uruguay (29.1%, a difference of 0.17%), and Immigrants from Nigeria (28.9%, a difference of 0.27%).
| Demographics | Rating | Rank | Single Mother Poverty |
| Immigrants | Hungary | 70.6 /100 | #158 | Good 28.9% |
| Czechs | 68.4 /100 | #159 | Good 28.9% |
| Japanese | 68.0 /100 | #160 | Good 28.9% |
| Immigrants | Cambodia | 66.6 /100 | #161 | Good 28.9% |
| Scandinavians | 66.2 /100 | #162 | Good 28.9% |
| Immigrants | Nigeria | 65.9 /100 | #163 | Good 28.9% |
| Immigrants | Kenya | 65.9 /100 | #164 | Good 28.9% |
| Arabs | 60.7 /100 | #165 | Good 29.0% |
| Inupiat | 60.4 /100 | #166 | Good 29.0% |
| Costa Ricans | 58.4 /100 | #167 | Average 29.0% |
| Europeans | 57.6 /100 | #168 | Average 29.1% |
| Immigrants | Uruguay | 57.2 /100 | #169 | Average 29.1% |
| New Zealanders | 55.1 /100 | #170 | Average 29.1% |
| Puget Sound Salish | 55.1 /100 | #171 | Average 29.1% |
| Carpatho Rusyns | 53.8 /100 | #172 | Average 29.1% |
Demographics Similar to Spanish Americans by Single Mother Poverty
In terms of single mother poverty, the demographic groups most similar to Spanish Americans are Immigrants from the Azores (32.2%, a difference of 0.25%), Indonesian (32.4%, a difference of 0.30%), Cree (32.2%, a difference of 0.36%), Nonimmigrants (32.2%, a difference of 0.39%), and Immigrants from Latin America (32.4%, a difference of 0.41%).
| Demographics | Rating | Rank | Single Mother Poverty |
| Delaware | 0.0 /100 | #276 | Tragic 31.8% |
| Mexican American Indians | 0.0 /100 | #277 | Tragic 31.9% |
| Immigrants | Zaire | 0.0 /100 | #278 | Tragic 32.0% |
| Marshallese | 0.0 /100 | #279 | Tragic 32.1% |
| Immigrants | Nonimmigrants | 0.0 /100 | #280 | Tragic 32.2% |
| Cree | 0.0 /100 | #281 | Tragic 32.2% |
| Immigrants | Azores | 0.0 /100 | #282 | Tragic 32.2% |
| Spanish Americans | 0.0 /100 | #283 | Tragic 32.3% |
| Indonesians | 0.0 /100 | #284 | Tragic 32.4% |
| Immigrants | Latin America | 0.0 /100 | #285 | Tragic 32.4% |
| Yup'ik | 0.0 /100 | #286 | Tragic 32.5% |
| Immigrants | Dominica | 0.0 /100 | #287 | Tragic 32.5% |
| Somalis | 0.0 /100 | #288 | Tragic 32.6% |
| U.S. Virgin Islanders | 0.0 /100 | #289 | Tragic 32.6% |
| Osage | 0.0 /100 | #290 | Tragic 32.6% |