Canadian vs Turkish Single Mother Poverty
COMPARE
Canadian
Turkish
Single Mother Poverty
Single Mother Poverty Comparison
Canadians
Turks
29.3%
SINGLE MOTHER POVERTY
40.4/ 100
METRIC RATING
181st/ 347
METRIC RANK
26.4%
SINGLE MOTHER POVERTY
100.0/ 100
METRIC RATING
30th/ 347
METRIC RANK
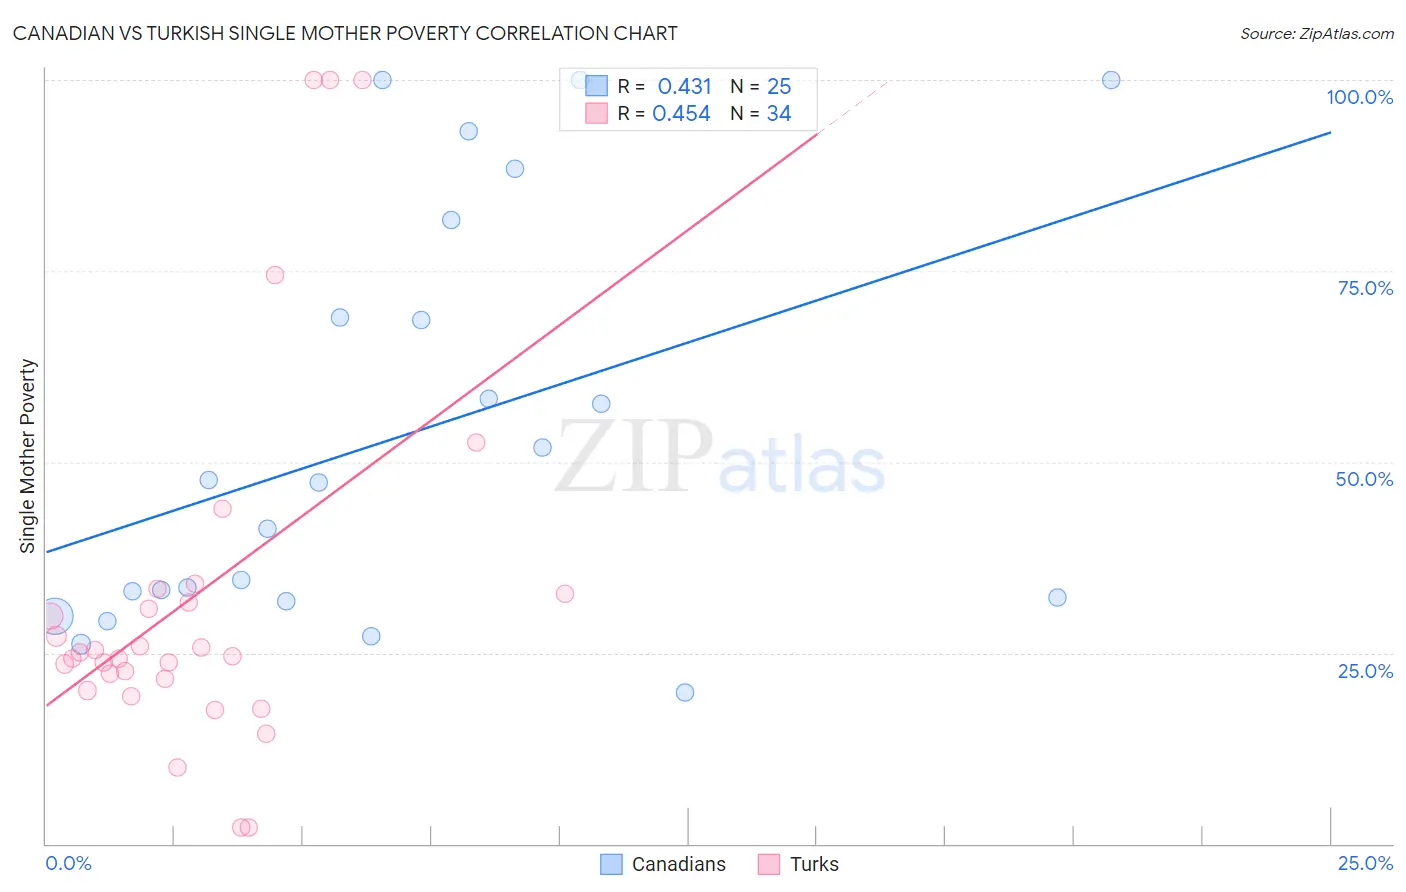
Canadian vs Turkish Single Mother Poverty Correlation Chart
The statistical analysis conducted on geographies consisting of 423,799,902 people shows a moderate positive correlation between the proportion of Canadians and poverty level among single mothers in the United States with a correlation coefficient (R) of 0.431 and weighted average of 29.3%. Similarly, the statistical analysis conducted on geographies consisting of 265,895,030 people shows a moderate positive correlation between the proportion of Turks and poverty level among single mothers in the United States with a correlation coefficient (R) of 0.454 and weighted average of 26.4%, a difference of 10.8%.
Single Mother Poverty Correlation Summary
| Measurement | Canadian | Turkish |
| Minimum | 19.9% | 2.2% |
| Maximum | 100.0% | 100.0% |
| Range | 80.1% | 97.8% |
| Mean | 53.4% | 32.5% |
| Median | 47.3% | 24.8% |
| Interquartile 25% (IQ1) | 32.0% | 21.6% |
| Interquartile 75% (IQ3) | 75.3% | 32.8% |
| Interquartile Range (IQR) | 43.3% | 11.2% |
| Standard Deviation (Sample) | 26.7% | 24.9% |
| Standard Deviation (Population) | 26.1% | 24.5% |
Similar Demographics by Single Mother Poverty
Demographics Similar to Canadians by Single Mother Poverty
In terms of single mother poverty, the demographic groups most similar to Canadians are Immigrants from Norway (29.3%, a difference of 0.060%), Immigrants from Eastern Africa (29.3%, a difference of 0.090%), Immigrants from Uzbekistan (29.3%, a difference of 0.11%), Nepalese (29.3%, a difference of 0.11%), and Nigerian (29.3%, a difference of 0.12%).
| Demographics | Rating | Rank | Single Mother Poverty |
| Immigrants | Saudi Arabia | 50.0 /100 | #174 | Average 29.2% |
| Immigrants | Costa Rica | 48.8 /100 | #175 | Average 29.2% |
| Hawaiians | 47.8 /100 | #176 | Average 29.2% |
| Immigrants | Bosnia and Herzegovina | 45.1 /100 | #177 | Average 29.2% |
| South American Indians | 43.2 /100 | #178 | Average 29.3% |
| Immigrants | Uzbekistan | 42.6 /100 | #179 | Average 29.3% |
| Immigrants | Norway | 41.5 /100 | #180 | Average 29.3% |
| Canadians | 40.4 /100 | #181 | Average 29.3% |
| Immigrants | Eastern Africa | 38.5 /100 | #182 | Fair 29.3% |
| Nepalese | 38.3 /100 | #183 | Fair 29.3% |
| Nigerians | 38.0 /100 | #184 | Fair 29.3% |
| Ghanaians | 36.8 /100 | #185 | Fair 29.4% |
| Yugoslavians | 36.0 /100 | #186 | Fair 29.4% |
| Lebanese | 32.5 /100 | #187 | Fair 29.4% |
| Guamanians/Chamorros | 31.8 /100 | #188 | Fair 29.4% |
Demographics Similar to Turks by Single Mother Poverty
In terms of single mother poverty, the demographic groups most similar to Turks are Jordanian (26.4%, a difference of 0.090%), Korean (26.4%, a difference of 0.14%), Immigrants from Japan (26.4%, a difference of 0.15%), Immigrants from Philippines (26.5%, a difference of 0.16%), and Immigrants from Sri Lanka (26.3%, a difference of 0.38%).
| Demographics | Rating | Rank | Single Mother Poverty |
| Burmese | 100.0 /100 | #23 | Exceptional 26.2% |
| Immigrants | Moldova | 100.0 /100 | #24 | Exceptional 26.2% |
| Immigrants | Asia | 100.0 /100 | #25 | Exceptional 26.3% |
| Immigrants | Sri Lanka | 100.0 /100 | #26 | Exceptional 26.3% |
| Immigrants | Japan | 100.0 /100 | #27 | Exceptional 26.4% |
| Koreans | 100.0 /100 | #28 | Exceptional 26.4% |
| Jordanians | 100.0 /100 | #29 | Exceptional 26.4% |
| Turks | 100.0 /100 | #30 | Exceptional 26.4% |
| Immigrants | Philippines | 100.0 /100 | #31 | Exceptional 26.5% |
| Tongans | 99.9 /100 | #32 | Exceptional 26.5% |
| Bulgarians | 99.9 /100 | #33 | Exceptional 26.5% |
| Immigrants | Indonesia | 99.9 /100 | #34 | Exceptional 26.6% |
| Maltese | 99.9 /100 | #35 | Exceptional 26.6% |
| Okinawans | 99.9 /100 | #36 | Exceptional 26.6% |
| Immigrants | Israel | 99.9 /100 | #37 | Exceptional 26.6% |