Arab vs Turkish Female Poverty Among 18-24 Year Olds
COMPARE
Arab
Turkish
Female Poverty Among 18-24 Year Olds
Female Poverty Among 18-24 Year Olds Comparison
Arabs
Turks
20.5%
FEMALE POVERTY AMONG 18-24 YEAR OLDS
15.5/ 100
METRIC RATING
209th/ 347
METRIC RANK
19.5%
FEMALE POVERTY AMONG 18-24 YEAR OLDS
92.1/ 100
METRIC RATING
133rd/ 347
METRIC RANK
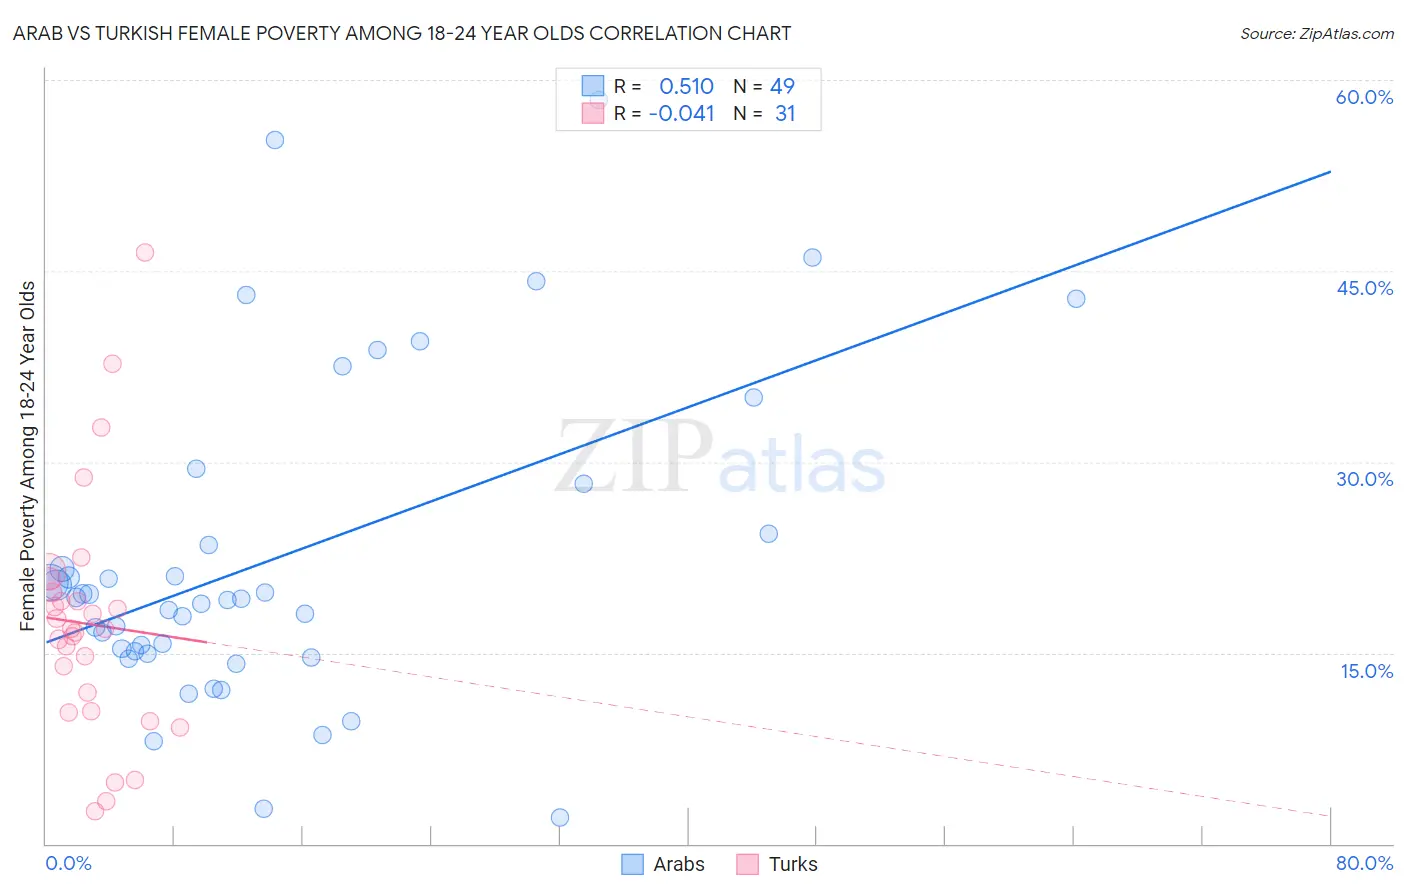
Arab vs Turkish Female Poverty Among 18-24 Year Olds Correlation Chart
The statistical analysis conducted on geographies consisting of 469,243,269 people shows a substantial positive correlation between the proportion of Arabs and poverty level among females between the ages 18 and 24 in the United States with a correlation coefficient (R) of 0.510 and weighted average of 20.5%. Similarly, the statistical analysis conducted on geographies consisting of 266,666,868 people shows no correlation between the proportion of Turks and poverty level among females between the ages 18 and 24 in the United States with a correlation coefficient (R) of -0.041 and weighted average of 19.5%, a difference of 5.2%.
Female Poverty Among 18-24 Year Olds Correlation Summary
| Measurement | Arab | Turkish |
| Minimum | 2.1% | 2.6% |
| Maximum | 58.5% | 46.5% |
| Range | 56.4% | 43.9% |
| Mean | 22.4% | 17.3% |
| Median | 19.3% | 16.9% |
| Interquartile 25% (IQ1) | 15.0% | 10.4% |
| Interquartile 75% (IQ3) | 26.3% | 19.7% |
| Interquartile Range (IQR) | 11.3% | 9.3% |
| Standard Deviation (Sample) | 12.6% | 9.5% |
| Standard Deviation (Population) | 12.5% | 9.3% |
Similar Demographics by Female Poverty Among 18-24 Year Olds
Demographics Similar to Arabs by Female Poverty Among 18-24 Year Olds
In terms of female poverty among 18-24 year olds, the demographic groups most similar to Arabs are Dutch (20.5%, a difference of 0.030%), Spaniard (20.5%, a difference of 0.070%), English (20.5%, a difference of 0.10%), Hispanic or Latino (20.5%, a difference of 0.10%), and Immigrants from Ghana (20.5%, a difference of 0.11%).
| Demographics | Rating | Rank | Female Poverty Among 18-24 Year Olds |
| Immigrants | Turkey | 17.7 /100 | #202 | Poor 20.5% |
| Immigrants | Malaysia | 17.2 /100 | #203 | Poor 20.5% |
| Immigrants | Netherlands | 17.0 /100 | #204 | Poor 20.5% |
| English | 16.7 /100 | #205 | Poor 20.5% |
| Hispanics or Latinos | 16.6 /100 | #206 | Poor 20.5% |
| Spaniards | 16.3 /100 | #207 | Poor 20.5% |
| Dutch | 15.9 /100 | #208 | Poor 20.5% |
| Arabs | 15.5 /100 | #209 | Poor 20.5% |
| Immigrants | Ghana | 14.3 /100 | #210 | Poor 20.5% |
| Immigrants | Western Europe | 13.5 /100 | #211 | Poor 20.6% |
| Liberians | 11.6 /100 | #212 | Poor 20.6% |
| Northern Europeans | 11.6 /100 | #213 | Poor 20.6% |
| Immigrants | South Africa | 10.7 /100 | #214 | Poor 20.6% |
| Spanish | 10.4 /100 | #215 | Poor 20.6% |
| Immigrants | Western Africa | 10.2 /100 | #216 | Poor 20.6% |
Demographics Similar to Turks by Female Poverty Among 18-24 Year Olds
In terms of female poverty among 18-24 year olds, the demographic groups most similar to Turks are Jamaican (19.5%, a difference of 0.0%), Immigrants from North America (19.5%, a difference of 0.010%), Soviet Union (19.5%, a difference of 0.020%), Latvian (19.5%, a difference of 0.11%), and Russian (19.5%, a difference of 0.11%).
| Demographics | Rating | Rank | Female Poverty Among 18-24 Year Olds |
| Immigrants | Russia | 93.7 /100 | #126 | Exceptional 19.4% |
| Cape Verdeans | 93.6 /100 | #127 | Exceptional 19.4% |
| Slovaks | 92.9 /100 | #128 | Exceptional 19.5% |
| Immigrants | England | 92.9 /100 | #129 | Exceptional 19.5% |
| Immigrants | Canada | 92.9 /100 | #130 | Exceptional 19.5% |
| Latvians | 92.7 /100 | #131 | Exceptional 19.5% |
| Jamaicans | 92.1 /100 | #132 | Exceptional 19.5% |
| Turks | 92.1 /100 | #133 | Exceptional 19.5% |
| Immigrants | North America | 92.1 /100 | #134 | Exceptional 19.5% |
| Soviet Union | 92.0 /100 | #135 | Exceptional 19.5% |
| Russians | 91.5 /100 | #136 | Exceptional 19.5% |
| Austrians | 90.7 /100 | #137 | Exceptional 19.5% |
| Immigrants | Morocco | 89.9 /100 | #138 | Excellent 19.6% |
| Indians (Asian) | 88.3 /100 | #139 | Excellent 19.6% |
| Immigrants | Trinidad and Tobago | 85.6 /100 | #140 | Excellent 19.7% |