Hmong vs Nonimmigrants Single Father Poverty
COMPARE
Hmong
Nonimmigrants
Single Father Poverty
Single Father Poverty Comparison
Hmong
Nonimmigrants
15.9%
SINGLE FATHER POVERTY
91.1/ 100
METRIC RATING
126th/ 347
METRIC RANK
18.8%
SINGLE FATHER POVERTY
0.0/ 100
METRIC RATING
311th/ 347
METRIC RANK
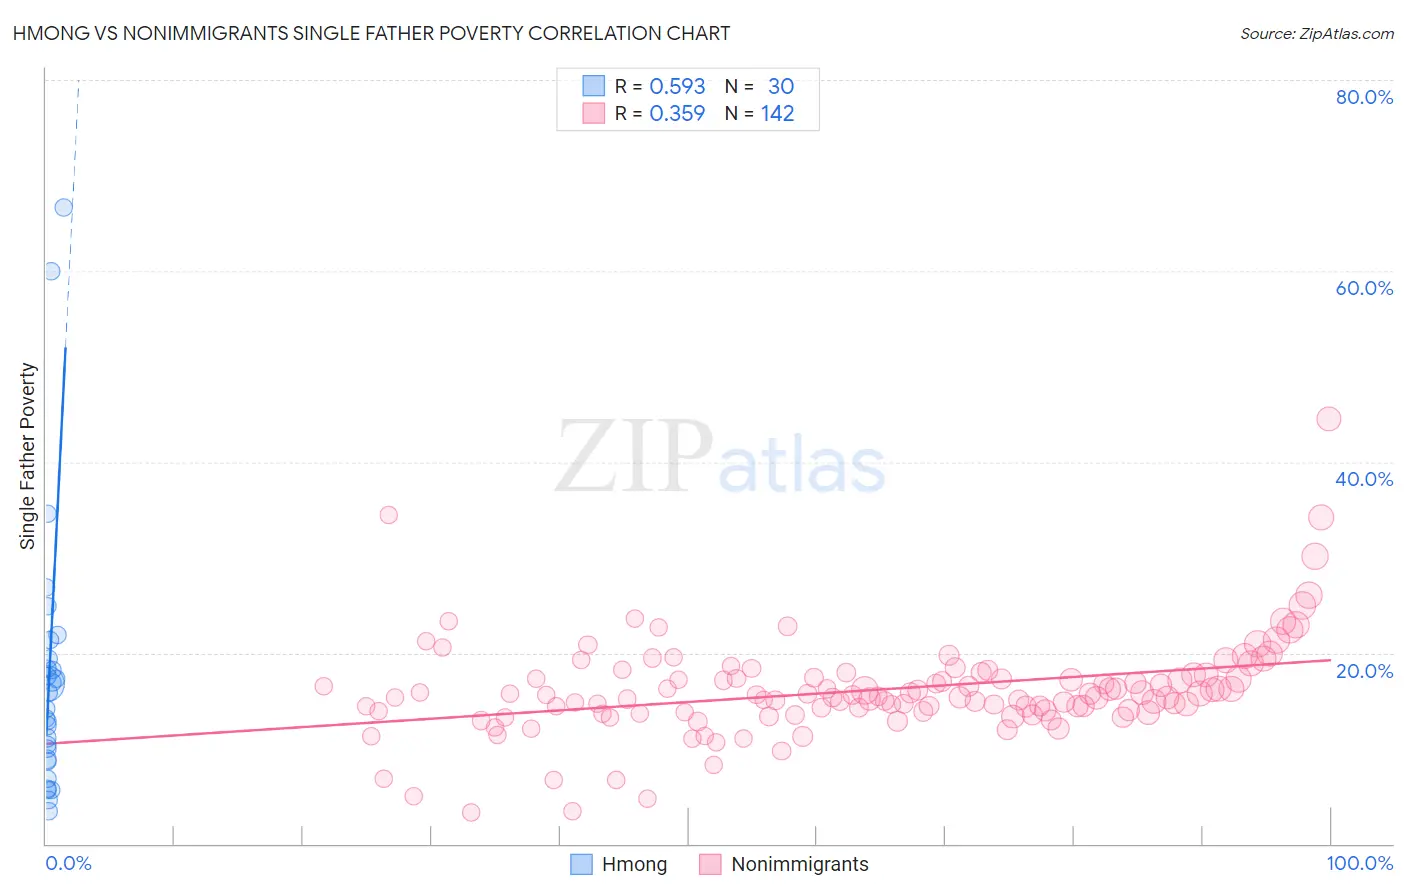
Hmong vs Nonimmigrants Single Father Poverty Correlation Chart
The statistical analysis conducted on geographies consisting of 23,884,581 people shows a substantial positive correlation between the proportion of Hmong and poverty level among single fathers in the United States with a correlation coefficient (R) of 0.593 and weighted average of 15.9%. Similarly, the statistical analysis conducted on geographies consisting of 414,706,444 people shows a mild positive correlation between the proportion of Nonimmigrants and poverty level among single fathers in the United States with a correlation coefficient (R) of 0.359 and weighted average of 18.8%, a difference of 18.7%.
Single Father Poverty Correlation Summary
| Measurement | Hmong | Nonimmigrants |
| Minimum | 3.4% | 3.3% |
| Maximum | 66.7% | 44.5% |
| Range | 63.3% | 41.2% |
| Mean | 17.7% | 16.1% |
| Median | 15.0% | 15.5% |
| Interquartile 25% (IQ1) | 8.8% | 13.9% |
| Interquartile 75% (IQ3) | 19.4% | 17.6% |
| Interquartile Range (IQR) | 10.6% | 3.8% |
| Standard Deviation (Sample) | 14.4% | 5.2% |
| Standard Deviation (Population) | 14.1% | 5.2% |
Similar Demographics by Single Father Poverty
Demographics Similar to Hmong by Single Father Poverty
In terms of single father poverty, the demographic groups most similar to Hmong are Iraqi (15.9%, a difference of 0.010%), Immigrants from Liberia (15.9%, a difference of 0.010%), Immigrants from Panama (15.9%, a difference of 0.020%), Palestinian (15.9%, a difference of 0.030%), and Immigrants from Nigeria (15.9%, a difference of 0.040%).
| Demographics | Rating | Rank | Single Father Poverty |
| Immigrants | Belarus | 92.4 /100 | #119 | Exceptional 15.8% |
| Uruguayans | 92.1 /100 | #120 | Exceptional 15.9% |
| Immigrants | Immigrants | 91.9 /100 | #121 | Exceptional 15.9% |
| Sudanese | 91.6 /100 | #122 | Exceptional 15.9% |
| Palestinians | 91.3 /100 | #123 | Exceptional 15.9% |
| Immigrants | Panama | 91.3 /100 | #124 | Exceptional 15.9% |
| Iraqis | 91.2 /100 | #125 | Exceptional 15.9% |
| Hmong | 91.1 /100 | #126 | Exceptional 15.9% |
| Immigrants | Liberia | 91.1 /100 | #127 | Exceptional 15.9% |
| Immigrants | Nigeria | 90.8 /100 | #128 | Exceptional 15.9% |
| Immigrants | West Indies | 90.8 /100 | #129 | Exceptional 15.9% |
| Norwegians | 90.2 /100 | #130 | Exceptional 15.9% |
| Nicaraguans | 90.1 /100 | #131 | Exceptional 15.9% |
| Immigrants | Portugal | 89.7 /100 | #132 | Excellent 15.9% |
| Immigrants | Syria | 89.5 /100 | #133 | Excellent 15.9% |
Demographics Similar to Nonimmigrants by Single Father Poverty
In terms of single father poverty, the demographic groups most similar to Nonimmigrants are Immigrants from Dominica (18.9%, a difference of 0.050%), Chippewa (18.8%, a difference of 0.19%), Potawatomi (18.9%, a difference of 0.25%), Delaware (18.9%, a difference of 0.42%), and Chickasaw (19.0%, a difference of 0.57%).
| Demographics | Rating | Rank | Single Father Poverty |
| Ute | 0.0 /100 | #304 | Tragic 18.5% |
| Blackfeet | 0.0 /100 | #305 | Tragic 18.5% |
| Scotch-Irish | 0.0 /100 | #306 | Tragic 18.6% |
| French Canadians | 0.0 /100 | #307 | Tragic 18.6% |
| Ottawa | 0.0 /100 | #308 | Tragic 18.6% |
| Immigrants | Micronesia | 0.0 /100 | #309 | Tragic 18.6% |
| Chippewa | 0.0 /100 | #310 | Tragic 18.8% |
| Immigrants | Nonimmigrants | 0.0 /100 | #311 | Tragic 18.8% |
| Immigrants | Dominica | 0.0 /100 | #312 | Tragic 18.9% |
| Potawatomi | 0.0 /100 | #313 | Tragic 18.9% |
| Delaware | 0.0 /100 | #314 | Tragic 18.9% |
| Chickasaw | 0.0 /100 | #315 | Tragic 19.0% |
| Osage | 0.0 /100 | #316 | Tragic 19.0% |
| Dominicans | 0.0 /100 | #317 | Tragic 19.1% |
| Dutch West Indians | 0.0 /100 | #318 | Tragic 19.2% |