Immigrants from Thailand vs Australian Single Father Poverty
COMPARE
Immigrants from Thailand
Australian
Single Father Poverty
Single Father Poverty Comparison
Immigrants from Thailand
Australians
15.8%
SINGLE FATHER POVERTY
93.6/ 100
METRIC RATING
115th/ 347
METRIC RANK
15.7%
SINGLE FATHER POVERTY
96.1/ 100
METRIC RATING
104th/ 347
METRIC RANK
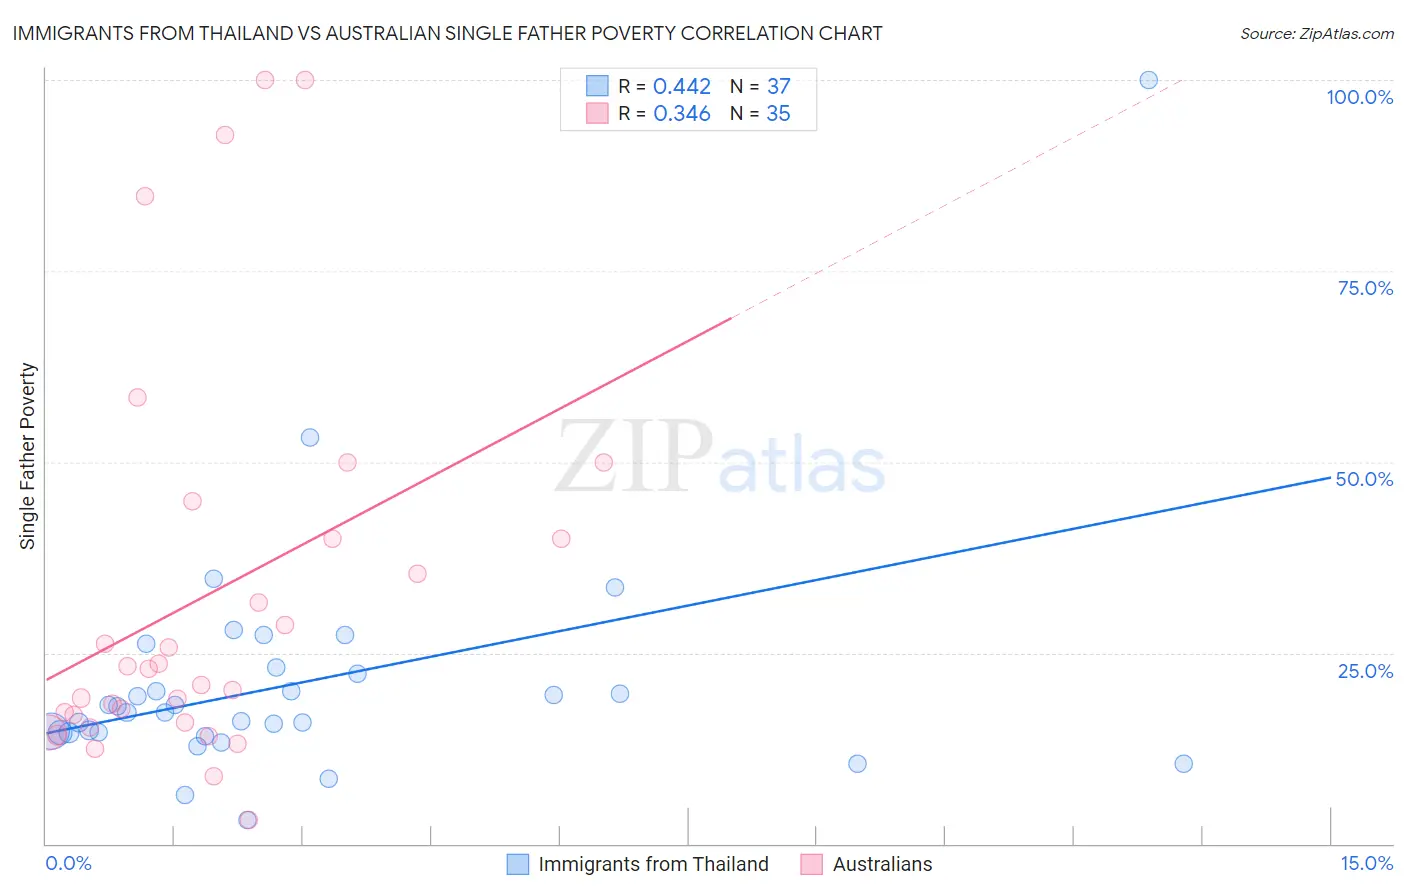
Immigrants from Thailand vs Australian Single Father Poverty Correlation Chart
The statistical analysis conducted on geographies consisting of 261,118,705 people shows a moderate positive correlation between the proportion of Immigrants from Thailand and poverty level among single fathers in the United States with a correlation coefficient (R) of 0.442 and weighted average of 15.8%. Similarly, the statistical analysis conducted on geographies consisting of 185,666,676 people shows a mild positive correlation between the proportion of Australians and poverty level among single fathers in the United States with a correlation coefficient (R) of 0.346 and weighted average of 15.7%, a difference of 0.61%.
Single Father Poverty Correlation Summary
| Measurement | Immigrants from Thailand | Australian |
| Minimum | 3.1% | 3.1% |
| Maximum | 100.0% | 100.0% |
| Range | 96.9% | 96.9% |
| Mean | 21.0% | 32.5% |
| Median | 17.2% | 22.9% |
| Interquartile 25% (IQ1) | 14.5% | 15.8% |
| Interquartile 75% (IQ3) | 22.7% | 40.0% |
| Interquartile Range (IQR) | 8.2% | 24.2% |
| Standard Deviation (Sample) | 16.0% | 25.8% |
| Standard Deviation (Population) | 15.8% | 25.5% |
Demographics Similar to Immigrants from Thailand and Australians by Single Father Poverty
In terms of single father poverty, the demographic groups most similar to Immigrants from Thailand are Immigrants from Argentina (15.8%, a difference of 0.14%), Argentinean (15.8%, a difference of 0.17%), Immigrants from Colombia (15.8%, a difference of 0.17%), Danish (15.8%, a difference of 0.19%), and Immigrants from Eastern Europe (15.8%, a difference of 0.19%). Similarly, the demographic groups most similar to Australians are Immigrants from Australia (15.7%, a difference of 0.010%), South American Indian (15.7%, a difference of 0.020%), Chilean (15.7%, a difference of 0.080%), Immigrants from Poland (15.7%, a difference of 0.080%), and Native Hawaiian (15.7%, a difference of 0.10%).
| Demographics | Rating | Rank | Single Father Poverty |
| Immigrants | Middle Africa | 97.4 /100 | #99 | Exceptional 15.6% |
| Immigrants | Chile | 96.9 /100 | #100 | Exceptional 15.7% |
| Fijians | 96.8 /100 | #101 | Exceptional 15.7% |
| Chileans | 96.4 /100 | #102 | Exceptional 15.7% |
| South American Indians | 96.2 /100 | #103 | Exceptional 15.7% |
| Australians | 96.1 /100 | #104 | Exceptional 15.7% |
| Immigrants | Australia | 96.1 /100 | #105 | Exceptional 15.7% |
| Immigrants | Poland | 95.8 /100 | #106 | Exceptional 15.7% |
| Native Hawaiians | 95.8 /100 | #107 | Exceptional 15.7% |
| Pakistanis | 95.7 /100 | #108 | Exceptional 15.7% |
| Turks | 95.1 /100 | #109 | Exceptional 15.8% |
| Immigrants | Africa | 95.1 /100 | #110 | Exceptional 15.8% |
| Bulgarians | 94.8 /100 | #111 | Exceptional 15.8% |
| Immigrants | Latvia | 94.7 /100 | #112 | Exceptional 15.8% |
| Danes | 94.5 /100 | #113 | Exceptional 15.8% |
| Argentineans | 94.4 /100 | #114 | Exceptional 15.8% |
| Immigrants | Thailand | 93.6 /100 | #115 | Exceptional 15.8% |
| Immigrants | Argentina | 92.8 /100 | #116 | Exceptional 15.8% |
| Immigrants | Colombia | 92.6 /100 | #117 | Exceptional 15.8% |
| Immigrants | Eastern Europe | 92.5 /100 | #118 | Exceptional 15.8% |
| Immigrants | Belarus | 92.4 /100 | #119 | Exceptional 15.8% |