Apache vs Australian Single Father Poverty
COMPARE
Apache
Australian
Single Father Poverty
Single Father Poverty Comparison
Apache
Australians
24.2%
SINGLE FATHER POVERTY
0.0/ 100
METRIC RATING
339th/ 347
METRIC RANK
15.7%
SINGLE FATHER POVERTY
96.1/ 100
METRIC RATING
104th/ 347
METRIC RANK
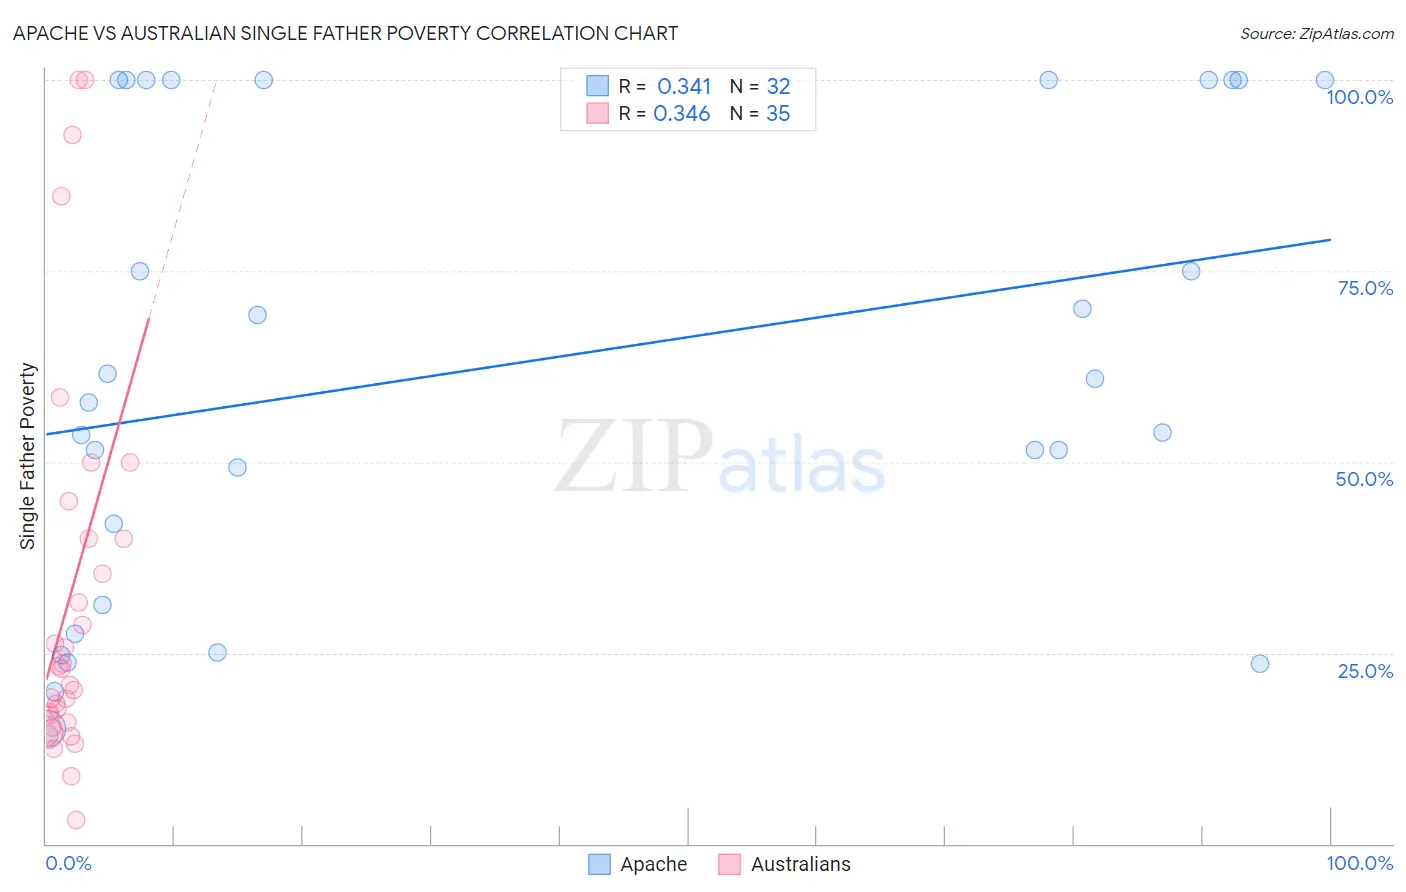
Apache vs Australian Single Father Poverty Correlation Chart
The statistical analysis conducted on geographies consisting of 199,792,986 people shows a mild positive correlation between the proportion of Apache and poverty level among single fathers in the United States with a correlation coefficient (R) of 0.341 and weighted average of 24.2%. Similarly, the statistical analysis conducted on geographies consisting of 185,666,676 people shows a mild positive correlation between the proportion of Australians and poverty level among single fathers in the United States with a correlation coefficient (R) of 0.346 and weighted average of 15.7%, a difference of 54.3%.
Single Father Poverty Correlation Summary
| Measurement | Apache | Australian |
| Minimum | 15.1% | 3.1% |
| Maximum | 100.0% | 100.0% |
| Range | 84.9% | 96.9% |
| Mean | 62.9% | 32.5% |
| Median | 59.3% | 22.9% |
| Interquartile 25% (IQ1) | 36.6% | 15.8% |
| Interquartile 75% (IQ3) | 100.0% | 40.0% |
| Interquartile Range (IQR) | 63.4% | 24.2% |
| Standard Deviation (Sample) | 29.9% | 25.8% |
| Standard Deviation (Population) | 29.4% | 25.5% |
Similar Demographics by Single Father Poverty
Demographics Similar to Apache by Single Father Poverty
In terms of single father poverty, the demographic groups most similar to Apache are Arapaho (24.0%, a difference of 1.1%), Sioux (23.9%, a difference of 1.5%), Cajun (23.1%, a difference of 5.1%), Shoshone (22.9%, a difference of 5.8%), and Kiowa (22.5%, a difference of 7.9%).
| Demographics | Rating | Rank | Single Father Poverty |
| Tohono O'odham | 0.0 /100 | #332 | Tragic 22.0% |
| Natives/Alaskans | 0.0 /100 | #333 | Tragic 22.4% |
| Kiowa | 0.0 /100 | #334 | Tragic 22.5% |
| Shoshone | 0.0 /100 | #335 | Tragic 22.9% |
| Cajuns | 0.0 /100 | #336 | Tragic 23.1% |
| Sioux | 0.0 /100 | #337 | Tragic 23.9% |
| Arapaho | 0.0 /100 | #338 | Tragic 24.0% |
| Apache | 0.0 /100 | #339 | Tragic 24.2% |
| Houma | 0.0 /100 | #340 | Tragic 26.7% |
| Hopi | 0.0 /100 | #341 | Tragic 27.2% |
| Yuman | 0.0 /100 | #342 | Tragic 28.4% |
| Lumbee | 0.0 /100 | #343 | Tragic 28.5% |
| Navajo | 0.0 /100 | #344 | Tragic 29.2% |
| Crow | 0.0 /100 | #345 | Tragic 30.3% |
| Puerto Ricans | 0.0 /100 | #346 | Tragic 31.5% |
Demographics Similar to Australians by Single Father Poverty
In terms of single father poverty, the demographic groups most similar to Australians are Immigrants from Australia (15.7%, a difference of 0.010%), South American Indian (15.7%, a difference of 0.020%), Chilean (15.7%, a difference of 0.080%), Immigrants from Poland (15.7%, a difference of 0.080%), and Native Hawaiian (15.7%, a difference of 0.10%).
| Demographics | Rating | Rank | Single Father Poverty |
| Yaqui | 98.1 /100 | #97 | Exceptional 15.6% |
| Zimbabweans | 98.1 /100 | #98 | Exceptional 15.6% |
| Immigrants | Middle Africa | 97.4 /100 | #99 | Exceptional 15.6% |
| Immigrants | Chile | 96.9 /100 | #100 | Exceptional 15.7% |
| Fijians | 96.8 /100 | #101 | Exceptional 15.7% |
| Chileans | 96.4 /100 | #102 | Exceptional 15.7% |
| South American Indians | 96.2 /100 | #103 | Exceptional 15.7% |
| Australians | 96.1 /100 | #104 | Exceptional 15.7% |
| Immigrants | Australia | 96.1 /100 | #105 | Exceptional 15.7% |
| Immigrants | Poland | 95.8 /100 | #106 | Exceptional 15.7% |
| Native Hawaiians | 95.8 /100 | #107 | Exceptional 15.7% |
| Pakistanis | 95.7 /100 | #108 | Exceptional 15.7% |
| Turks | 95.1 /100 | #109 | Exceptional 15.8% |
| Immigrants | Africa | 95.1 /100 | #110 | Exceptional 15.8% |
| Bulgarians | 94.8 /100 | #111 | Exceptional 15.8% |