Bhutanese vs Immigrants from Israel Poverty
COMPARE
Bhutanese
Immigrants from Israel
Poverty
Poverty Comparison
Bhutanese
Immigrants from Israel
10.4%
POVERTY
99.8/ 100
METRIC RATING
12th/ 347
METRIC RANK
11.7%
POVERTY
87.4/ 100
METRIC RATING
128th/ 347
METRIC RANK
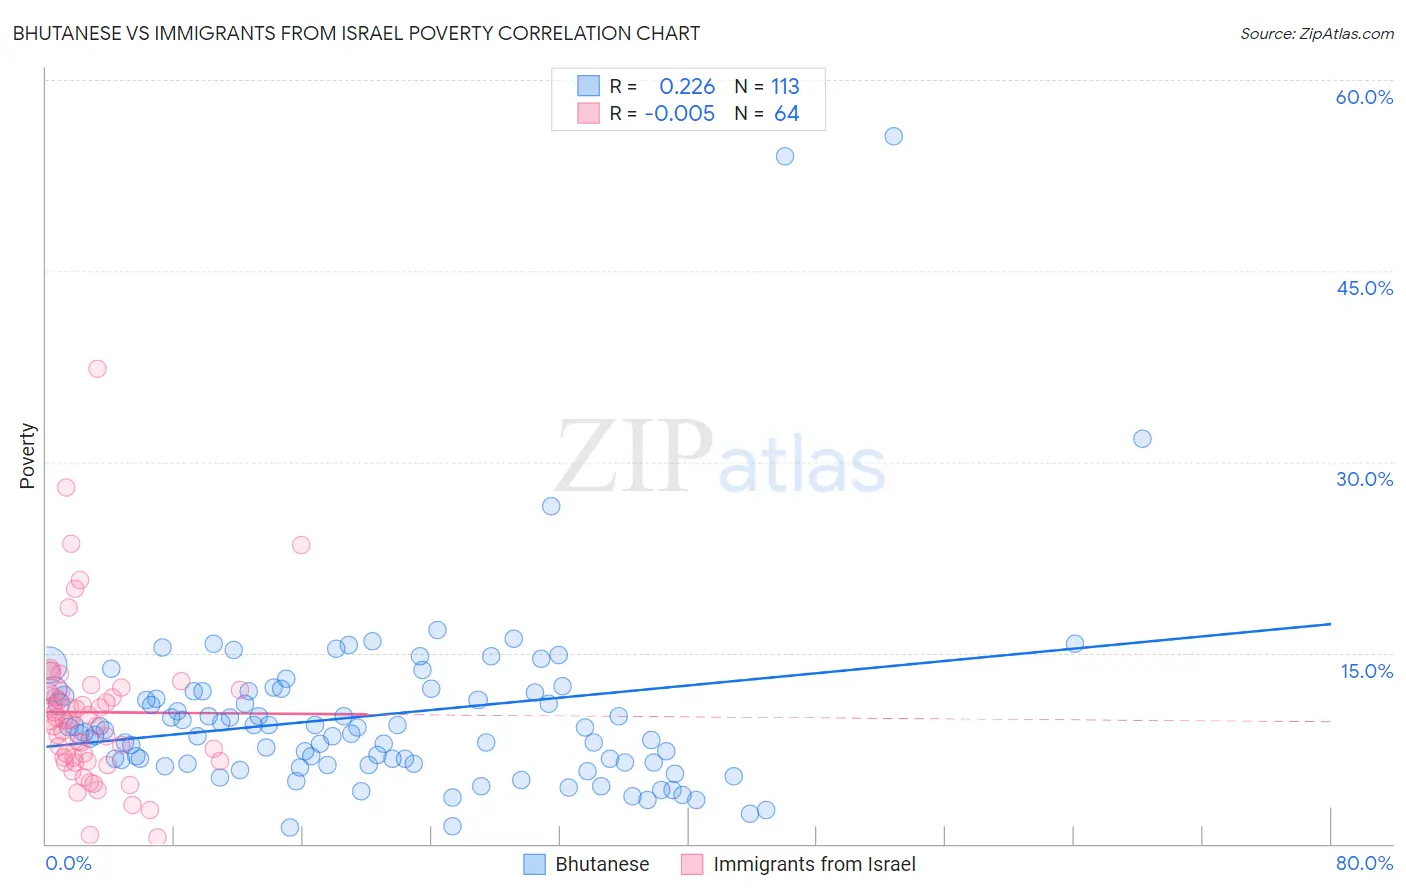
Bhutanese vs Immigrants from Israel Poverty Correlation Chart
The statistical analysis conducted on geographies consisting of 455,158,170 people shows a weak positive correlation between the proportion of Bhutanese and poverty level in the United States with a correlation coefficient (R) of 0.226 and weighted average of 10.4%. Similarly, the statistical analysis conducted on geographies consisting of 209,974,563 people shows no correlation between the proportion of Immigrants from Israel and poverty level in the United States with a correlation coefficient (R) of -0.005 and weighted average of 11.7%, a difference of 13.1%.
Poverty Correlation Summary
| Measurement | Bhutanese | Immigrants from Israel |
| Minimum | 1.3% | 0.47% |
| Maximum | 55.6% | 37.3% |
| Range | 54.3% | 36.8% |
| Mean | 10.1% | 10.3% |
| Median | 9.0% | 9.7% |
| Interquartile 25% (IQ1) | 6.3% | 6.6% |
| Interquartile 75% (IQ3) | 12.0% | 11.9% |
| Interquartile Range (IQR) | 5.6% | 5.2% |
| Standard Deviation (Sample) | 7.5% | 6.2% |
| Standard Deviation (Population) | 7.5% | 6.1% |
Similar Demographics by Poverty
Demographics Similar to Bhutanese by Poverty
In terms of poverty, the demographic groups most similar to Bhutanese are Immigrants from Hong Kong (10.4%, a difference of 0.22%), Immigrants from Lithuania (10.3%, a difference of 0.35%), Immigrants from Bolivia (10.4%, a difference of 0.53%), Bolivian (10.4%, a difference of 0.54%), and Lithuanian (10.5%, a difference of 0.84%).
| Demographics | Rating | Rank | Poverty |
| Immigrants | Ireland | 99.9 /100 | #5 | Exceptional 10.1% |
| Assyrians/Chaldeans/Syriacs | 99.9 /100 | #6 | Exceptional 10.1% |
| Filipinos | 99.9 /100 | #7 | Exceptional 10.1% |
| Maltese | 99.9 /100 | #8 | Exceptional 10.2% |
| Immigrants | South Central Asia | 99.9 /100 | #9 | Exceptional 10.2% |
| Bulgarians | 99.9 /100 | #10 | Exceptional 10.2% |
| Immigrants | Lithuania | 99.9 /100 | #11 | Exceptional 10.3% |
| Bhutanese | 99.8 /100 | #12 | Exceptional 10.4% |
| Immigrants | Hong Kong | 99.8 /100 | #13 | Exceptional 10.4% |
| Immigrants | Bolivia | 99.8 /100 | #14 | Exceptional 10.4% |
| Bolivians | 99.8 /100 | #15 | Exceptional 10.4% |
| Lithuanians | 99.8 /100 | #16 | Exceptional 10.5% |
| Norwegians | 99.8 /100 | #17 | Exceptional 10.5% |
| Latvians | 99.8 /100 | #18 | Exceptional 10.5% |
| Immigrants | Scotland | 99.7 /100 | #19 | Exceptional 10.6% |
Demographics Similar to Immigrants from Israel by Poverty
In terms of poverty, the demographic groups most similar to Immigrants from Israel are South African (11.7%, a difference of 0.090%), Immigrants from Argentina (11.7%, a difference of 0.13%), Immigrants from Norway (11.7%, a difference of 0.14%), Immigrants from Brazil (11.7%, a difference of 0.18%), and Immigrants from Ukraine (11.8%, a difference of 0.19%).
| Demographics | Rating | Rank | Poverty |
| New Zealanders | 88.7 /100 | #121 | Excellent 11.7% |
| Puget Sound Salish | 88.7 /100 | #122 | Excellent 11.7% |
| Immigrants | Hungary | 88.6 /100 | #123 | Excellent 11.7% |
| Soviet Union | 88.4 /100 | #124 | Excellent 11.7% |
| Immigrants | Brazil | 88.2 /100 | #125 | Excellent 11.7% |
| Immigrants | Norway | 88.0 /100 | #126 | Excellent 11.7% |
| Immigrants | Argentina | 88.0 /100 | #127 | Excellent 11.7% |
| Immigrants | Israel | 87.4 /100 | #128 | Excellent 11.7% |
| South Africans | 87.0 /100 | #129 | Excellent 11.7% |
| Immigrants | Ukraine | 86.6 /100 | #130 | Excellent 11.8% |
| French | 86.1 /100 | #131 | Excellent 11.8% |
| Peruvians | 85.6 /100 | #132 | Excellent 11.8% |
| Immigrants | Western Europe | 85.2 /100 | #133 | Excellent 11.8% |
| Yugoslavians | 85.2 /100 | #134 | Excellent 11.8% |
| Immigrants | Vietnam | 85.2 /100 | #135 | Excellent 11.8% |