Macedonian vs Immigrants from Israel Poverty
COMPARE
Macedonian
Immigrants from Israel
Poverty
Poverty Comparison
Macedonians
Immigrants from Israel
10.8%
POVERTY
99.4/ 100
METRIC RATING
33rd/ 347
METRIC RANK
11.7%
POVERTY
87.4/ 100
METRIC RATING
128th/ 347
METRIC RANK
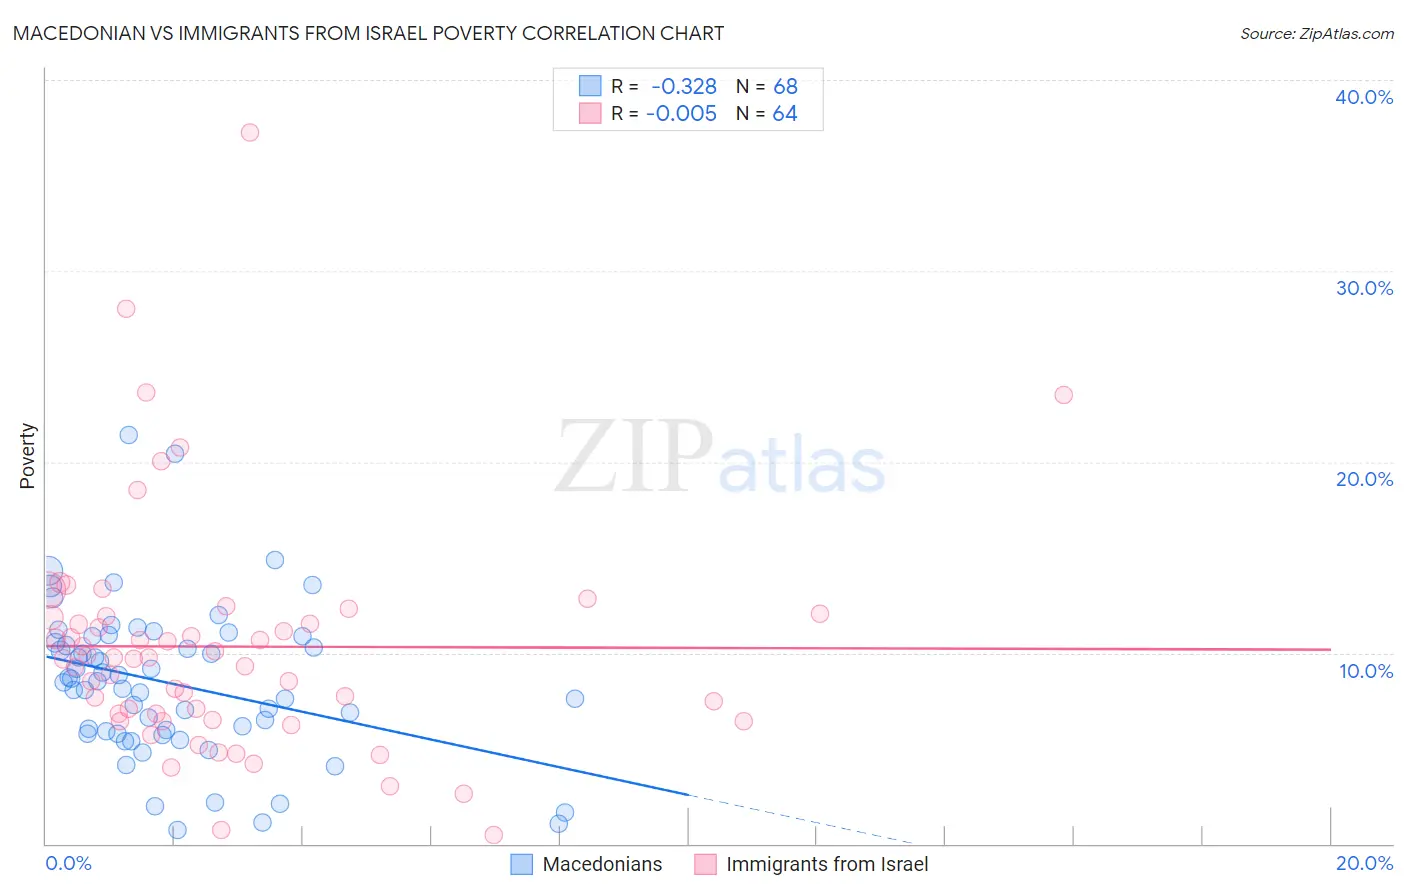
Macedonian vs Immigrants from Israel Poverty Correlation Chart
The statistical analysis conducted on geographies consisting of 132,607,264 people shows a mild negative correlation between the proportion of Macedonians and poverty level in the United States with a correlation coefficient (R) of -0.328 and weighted average of 10.8%. Similarly, the statistical analysis conducted on geographies consisting of 209,974,563 people shows no correlation between the proportion of Immigrants from Israel and poverty level in the United States with a correlation coefficient (R) of -0.005 and weighted average of 11.7%, a difference of 8.7%.
Poverty Correlation Summary
| Measurement | Macedonian | Immigrants from Israel |
| Minimum | 0.75% | 0.47% |
| Maximum | 21.4% | 37.3% |
| Range | 20.7% | 36.8% |
| Mean | 8.4% | 10.3% |
| Median | 8.5% | 9.7% |
| Interquartile 25% (IQ1) | 5.8% | 6.6% |
| Interquartile 75% (IQ3) | 10.7% | 11.9% |
| Interquartile Range (IQR) | 4.9% | 5.2% |
| Standard Deviation (Sample) | 4.0% | 6.2% |
| Standard Deviation (Population) | 4.0% | 6.1% |
Similar Demographics by Poverty
Demographics Similar to Macedonians by Poverty
In terms of poverty, the demographic groups most similar to Macedonians are Immigrants from Poland (10.8%, a difference of 0.090%), Tongan (10.8%, a difference of 0.14%), Cypriot (10.8%, a difference of 0.21%), Immigrants from Greece (10.8%, a difference of 0.31%), and Czech (10.8%, a difference of 0.36%).
| Demographics | Rating | Rank | Poverty |
| Burmese | 99.6 /100 | #26 | Exceptional 10.7% |
| Immigrants | Northern Europe | 99.6 /100 | #27 | Exceptional 10.7% |
| Immigrants | Korea | 99.5 /100 | #28 | Exceptional 10.7% |
| Greeks | 99.5 /100 | #29 | Exceptional 10.7% |
| Danes | 99.5 /100 | #30 | Exceptional 10.7% |
| Poles | 99.5 /100 | #31 | Exceptional 10.7% |
| Iranians | 99.5 /100 | #32 | Exceptional 10.7% |
| Macedonians | 99.4 /100 | #33 | Exceptional 10.8% |
| Immigrants | Poland | 99.4 /100 | #34 | Exceptional 10.8% |
| Tongans | 99.4 /100 | #35 | Exceptional 10.8% |
| Cypriots | 99.3 /100 | #36 | Exceptional 10.8% |
| Immigrants | Greece | 99.3 /100 | #37 | Exceptional 10.8% |
| Czechs | 99.3 /100 | #38 | Exceptional 10.8% |
| Immigrants | Pakistan | 99.3 /100 | #39 | Exceptional 10.8% |
| Russians | 99.3 /100 | #40 | Exceptional 10.9% |
Demographics Similar to Immigrants from Israel by Poverty
In terms of poverty, the demographic groups most similar to Immigrants from Israel are South African (11.7%, a difference of 0.090%), Immigrants from Argentina (11.7%, a difference of 0.13%), Immigrants from Norway (11.7%, a difference of 0.14%), Immigrants from Brazil (11.7%, a difference of 0.18%), and Immigrants from Ukraine (11.8%, a difference of 0.19%).
| Demographics | Rating | Rank | Poverty |
| New Zealanders | 88.7 /100 | #121 | Excellent 11.7% |
| Puget Sound Salish | 88.7 /100 | #122 | Excellent 11.7% |
| Immigrants | Hungary | 88.6 /100 | #123 | Excellent 11.7% |
| Soviet Union | 88.4 /100 | #124 | Excellent 11.7% |
| Immigrants | Brazil | 88.2 /100 | #125 | Excellent 11.7% |
| Immigrants | Norway | 88.0 /100 | #126 | Excellent 11.7% |
| Immigrants | Argentina | 88.0 /100 | #127 | Excellent 11.7% |
| Immigrants | Israel | 87.4 /100 | #128 | Excellent 11.7% |
| South Africans | 87.0 /100 | #129 | Excellent 11.7% |
| Immigrants | Ukraine | 86.6 /100 | #130 | Excellent 11.8% |
| French | 86.1 /100 | #131 | Excellent 11.8% |
| Peruvians | 85.6 /100 | #132 | Excellent 11.8% |
| Immigrants | Western Europe | 85.2 /100 | #133 | Excellent 11.8% |
| Yugoslavians | 85.2 /100 | #134 | Excellent 11.8% |
| Immigrants | Vietnam | 85.2 /100 | #135 | Excellent 11.8% |