Alaskan Athabascan vs Ecuadorian Child Poverty Under the Age of 5
COMPARE
Alaskan Athabascan
Ecuadorian
Child Poverty Under the Age of 5
Child Poverty Under the Age of 5 Comparison
Alaskan Athabascans
Ecuadorians
21.8%
CHILD POVERTY UNDER THE AGE OF 5
0.0/ 100
METRIC RATING
300th/ 347
METRIC RANK
19.2%
CHILD POVERTY UNDER THE AGE OF 5
1.2/ 100
METRIC RATING
230th/ 347
METRIC RANK
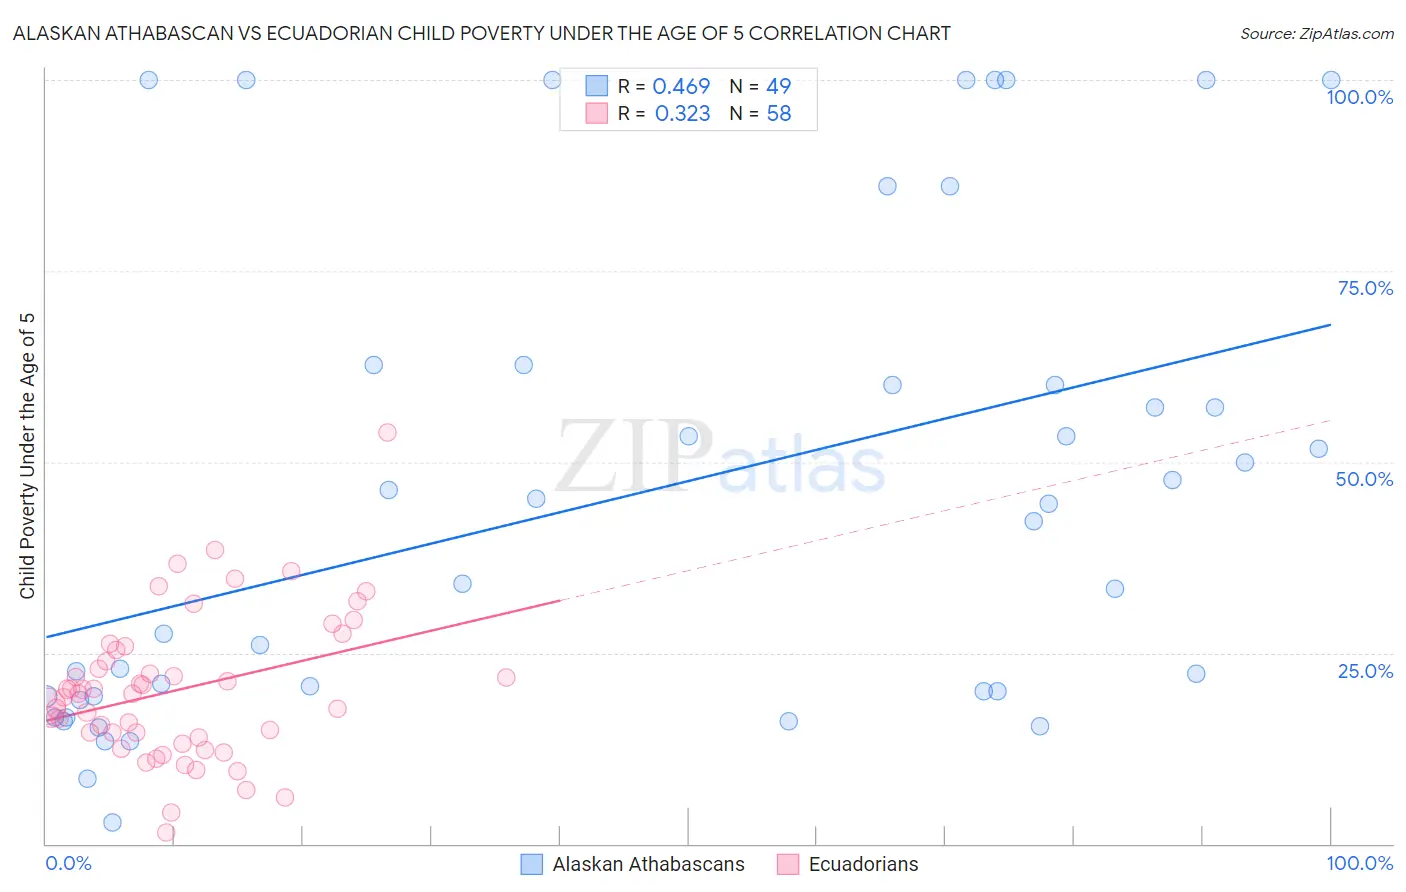
Alaskan Athabascan vs Ecuadorian Child Poverty Under the Age of 5 Correlation Chart
The statistical analysis conducted on geographies consisting of 45,439,676 people shows a moderate positive correlation between the proportion of Alaskan Athabascans and poverty level among children under the age of 5 in the United States with a correlation coefficient (R) of 0.469 and weighted average of 21.8%. Similarly, the statistical analysis conducted on geographies consisting of 306,907,692 people shows a mild positive correlation between the proportion of Ecuadorians and poverty level among children under the age of 5 in the United States with a correlation coefficient (R) of 0.323 and weighted average of 19.2%, a difference of 13.6%.
Child Poverty Under the Age of 5 Correlation Summary
| Measurement | Alaskan Athabascan | Ecuadorian |
| Minimum | 2.7% | 1.5% |
| Maximum | 100.0% | 53.9% |
| Range | 97.3% | 52.3% |
| Mean | 45.5% | 20.1% |
| Median | 42.3% | 19.7% |
| Interquartile 25% (IQ1) | 19.3% | 13.9% |
| Interquartile 75% (IQ3) | 61.3% | 25.4% |
| Interquartile Range (IQR) | 42.0% | 11.5% |
| Standard Deviation (Sample) | 31.0% | 9.5% |
| Standard Deviation (Population) | 30.7% | 9.5% |
Similar Demographics by Child Poverty Under the Age of 5
Demographics Similar to Alaskan Athabascans by Child Poverty Under the Age of 5
In terms of child poverty under the age of 5, the demographic groups most similar to Alaskan Athabascans are Blackfeet (21.8%, a difference of 0.010%), Chickasaw (21.8%, a difference of 0.010%), Hispanic or Latino (21.7%, a difference of 0.40%), Yaqui (21.7%, a difference of 0.41%), and Cherokee (21.7%, a difference of 0.57%).
| Demographics | Rating | Rank | Child Poverty Under the Age of 5 |
| Mexicans | 0.0 /100 | #293 | Tragic 21.6% |
| Guatemalans | 0.0 /100 | #294 | Tragic 21.6% |
| Cherokee | 0.0 /100 | #295 | Tragic 21.7% |
| Yaqui | 0.0 /100 | #296 | Tragic 21.7% |
| Hispanics or Latinos | 0.0 /100 | #297 | Tragic 21.7% |
| Blackfeet | 0.0 /100 | #298 | Tragic 21.8% |
| Chickasaw | 0.0 /100 | #299 | Tragic 21.8% |
| Alaskan Athabascans | 0.0 /100 | #300 | Tragic 21.8% |
| Immigrants | Central America | 0.0 /100 | #301 | Tragic 22.0% |
| Iroquois | 0.0 /100 | #302 | Tragic 22.0% |
| Inupiat | 0.0 /100 | #303 | Tragic 22.0% |
| Immigrants | Guatemala | 0.0 /100 | #304 | Tragic 22.0% |
| Immigrants | Mexico | 0.0 /100 | #305 | Tragic 22.2% |
| Indonesians | 0.0 /100 | #306 | Tragic 22.3% |
| Immigrants | Bahamas | 0.0 /100 | #307 | Tragic 22.7% |
Demographics Similar to Ecuadorians by Child Poverty Under the Age of 5
In terms of child poverty under the age of 5, the demographic groups most similar to Ecuadorians are Ghanaian (19.2%, a difference of 0.040%), Bermudan (19.2%, a difference of 0.050%), Immigrants from Sudan (19.2%, a difference of 0.12%), Cape Verdean (19.1%, a difference of 0.43%), and Immigrants from Eritrea (19.1%, a difference of 0.61%).
| Demographics | Rating | Rank | Child Poverty Under the Age of 5 |
| Cubans | 1.7 /100 | #223 | Tragic 19.1% |
| Nicaraguans | 1.6 /100 | #224 | Tragic 19.1% |
| Nigerians | 1.6 /100 | #225 | Tragic 19.1% |
| Immigrants | Eritrea | 1.5 /100 | #226 | Tragic 19.1% |
| Cape Verdeans | 1.4 /100 | #227 | Tragic 19.1% |
| Immigrants | Sudan | 1.3 /100 | #228 | Tragic 19.2% |
| Ghanaians | 1.2 /100 | #229 | Tragic 19.2% |
| Ecuadorians | 1.2 /100 | #230 | Tragic 19.2% |
| Bermudans | 1.2 /100 | #231 | Tragic 19.2% |
| Trinidadians and Tobagonians | 0.9 /100 | #232 | Tragic 19.3% |
| Sudanese | 0.9 /100 | #233 | Tragic 19.3% |
| Immigrants | Micronesia | 0.9 /100 | #234 | Tragic 19.4% |
| Immigrants | Laos | 0.8 /100 | #235 | Tragic 19.4% |
| Immigrants | Trinidad and Tobago | 0.8 /100 | #236 | Tragic 19.4% |
| Immigrants | Cabo Verde | 0.6 /100 | #237 | Tragic 19.5% |