American vs Cheyenne Unemployment Among Women with Children Under 6 years
COMPARE
American
Cheyenne
Unemployment Among Women with Children Under 6 years
Unemployment Among Women with Children Under 6 years Comparison
Americans
Cheyenne
9.3%
UNEMPLOYMENT AMONG WOMEN WITH CHILDREN UNDER 6 YEARS
0.0/ 100
METRIC RATING
313th/ 347
METRIC RANK
8.8%
UNEMPLOYMENT AMONG WOMEN WITH CHILDREN UNDER 6 YEARS
0.0/ 100
METRIC RATING
292nd/ 347
METRIC RANK
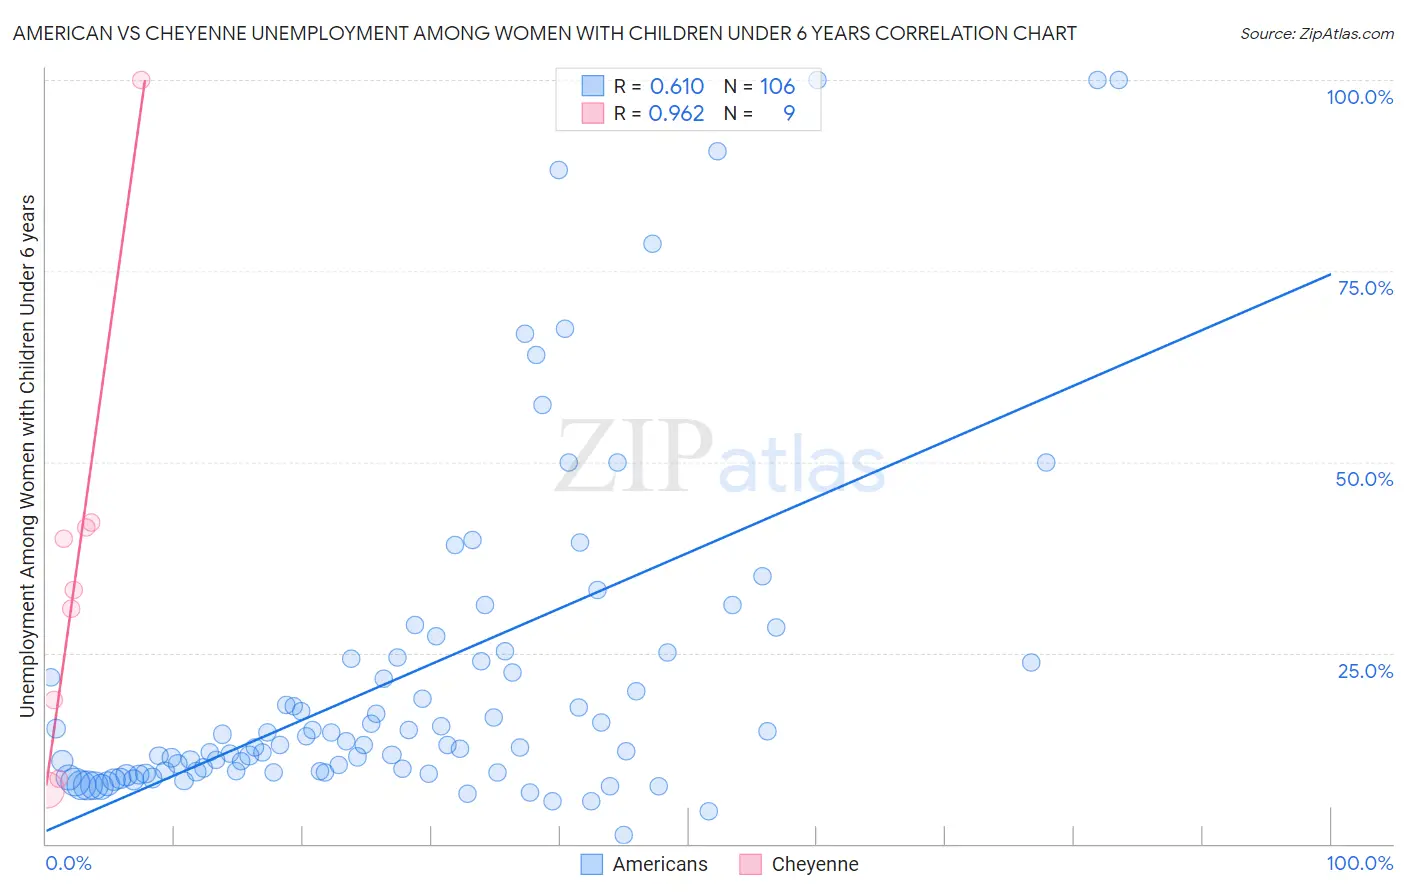
American vs Cheyenne Unemployment Among Women with Children Under 6 years Correlation Chart
The statistical analysis conducted on geographies consisting of 380,925,631 people shows a significant positive correlation between the proportion of Americans and unemployment rate among women with children under the age of 6 in the United States with a correlation coefficient (R) of 0.610 and weighted average of 9.3%. Similarly, the statistical analysis conducted on geographies consisting of 73,227,790 people shows a perfect positive correlation between the proportion of Cheyenne and unemployment rate among women with children under the age of 6 in the United States with a correlation coefficient (R) of 0.962 and weighted average of 8.8%, a difference of 5.0%.
Unemployment Among Women with Children Under 6 years Correlation Summary
| Measurement | American | Cheyenne |
| Minimum | 1.1% | 7.0% |
| Maximum | 100.0% | 100.0% |
| Range | 98.9% | 93.0% |
| Mean | 22.1% | 35.8% |
| Median | 12.9% | 33.3% |
| Interquartile 25% (IQ1) | 9.4% | 13.7% |
| Interquartile 75% (IQ3) | 24.2% | 41.7% |
| Interquartile Range (IQR) | 14.8% | 28.0% |
| Standard Deviation (Sample) | 22.1% | 27.6% |
| Standard Deviation (Population) | 21.9% | 26.0% |
Similar Demographics by Unemployment Among Women with Children Under 6 years
Demographics Similar to Americans by Unemployment Among Women with Children Under 6 years
In terms of unemployment among women with children under 6 years, the demographic groups most similar to Americans are Fijian (9.3%, a difference of 0.030%), Immigrants from the Azores (9.2%, a difference of 0.44%), French American Indian (9.2%, a difference of 0.58%), Cherokee (9.3%, a difference of 0.80%), and Cajun (9.2%, a difference of 0.86%).
| Demographics | Rating | Rank | Unemployment Among Women with Children Under 6 years |
| Pueblo | 0.0 /100 | #306 | Tragic 9.1% |
| Dominicans | 0.0 /100 | #307 | Tragic 9.1% |
| Immigrants | Micronesia | 0.0 /100 | #308 | Tragic 9.1% |
| Africans | 0.0 /100 | #309 | Tragic 9.2% |
| Cajuns | 0.0 /100 | #310 | Tragic 9.2% |
| French American Indians | 0.0 /100 | #311 | Tragic 9.2% |
| Immigrants | Azores | 0.0 /100 | #312 | Tragic 9.2% |
| Americans | 0.0 /100 | #313 | Tragic 9.3% |
| Fijians | 0.0 /100 | #314 | Tragic 9.3% |
| Cherokee | 0.0 /100 | #315 | Tragic 9.3% |
| Houma | 0.0 /100 | #316 | Tragic 9.4% |
| Dutch West Indians | 0.0 /100 | #317 | Tragic 9.5% |
| Osage | 0.0 /100 | #318 | Tragic 9.5% |
| Marshallese | 0.0 /100 | #319 | Tragic 9.6% |
| Potawatomi | 0.0 /100 | #320 | Tragic 9.6% |
Demographics Similar to Cheyenne by Unemployment Among Women with Children Under 6 years
In terms of unemployment among women with children under 6 years, the demographic groups most similar to Cheyenne are Immigrants from Bangladesh (8.8%, a difference of 0.23%), Jamaican (8.8%, a difference of 0.25%), Nonimmigrants (8.8%, a difference of 0.42%), Immigrants from Central America (8.9%, a difference of 0.46%), and Immigrants from Dominican Republic (8.9%, a difference of 0.60%).
| Demographics | Rating | Rank | Unemployment Among Women with Children Under 6 years |
| U.S. Virgin Islanders | 0.0 /100 | #285 | Tragic 8.7% |
| Seminole | 0.0 /100 | #286 | Tragic 8.7% |
| Menominee | 0.0 /100 | #287 | Tragic 8.7% |
| Bahamians | 0.0 /100 | #288 | Tragic 8.7% |
| Iroquois | 0.0 /100 | #289 | Tragic 8.7% |
| Vietnamese | 0.0 /100 | #290 | Tragic 8.8% |
| Jamaicans | 0.0 /100 | #291 | Tragic 8.8% |
| Cheyenne | 0.0 /100 | #292 | Tragic 8.8% |
| Immigrants | Bangladesh | 0.0 /100 | #293 | Tragic 8.8% |
| Immigrants | Nonimmigrants | 0.0 /100 | #294 | Tragic 8.8% |
| Immigrants | Central America | 0.0 /100 | #295 | Tragic 8.9% |
| Immigrants | Dominican Republic | 0.0 /100 | #296 | Tragic 8.9% |
| Mexicans | 0.0 /100 | #297 | Tragic 8.9% |
| Tlingit-Haida | 0.0 /100 | #298 | Tragic 8.9% |
| Immigrants | Jamaica | 0.0 /100 | #299 | Tragic 8.9% |