American vs Inupiat Child Poverty Among Girls Under 16
COMPARE
American
Inupiat
Child Poverty Among Girls Under 16
Child Poverty Among Girls Under 16 Comparison
Americans
Inupiat
18.8%
CHILD POVERTY AMONG GIRLS UNDER 16
0.8/ 100
METRIC RATING
241st/ 347
METRIC RANK
20.8%
CHILD POVERTY AMONG GIRLS UNDER 16
0.0/ 100
METRIC RATING
297th/ 347
METRIC RANK
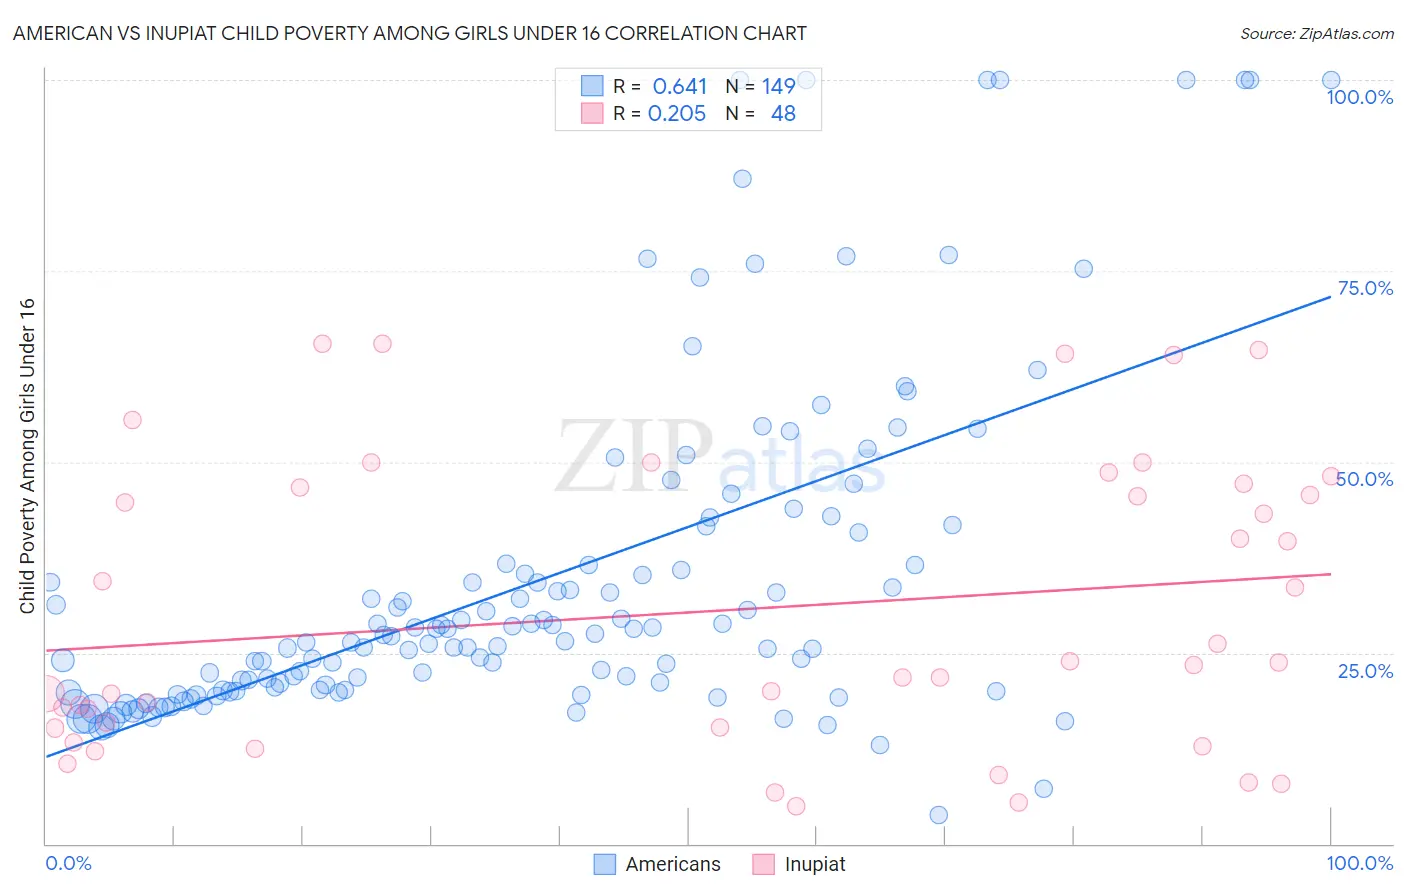
American vs Inupiat Child Poverty Among Girls Under 16 Correlation Chart
The statistical analysis conducted on geographies consisting of 557,572,763 people shows a significant positive correlation between the proportion of Americans and poverty level among girls under the age of 16 in the United States with a correlation coefficient (R) of 0.641 and weighted average of 18.8%. Similarly, the statistical analysis conducted on geographies consisting of 95,999,141 people shows a weak positive correlation between the proportion of Inupiat and poverty level among girls under the age of 16 in the United States with a correlation coefficient (R) of 0.205 and weighted average of 20.8%, a difference of 10.6%.
Child Poverty Among Girls Under 16 Correlation Summary
| Measurement | American | Inupiat |
| Minimum | 3.7% | 5.0% |
| Maximum | 100.0% | 65.5% |
| Range | 96.3% | 60.5% |
| Mean | 34.4% | 30.6% |
| Median | 26.6% | 23.6% |
| Interquartile 25% (IQ1) | 20.0% | 15.2% |
| Interquartile 75% (IQ3) | 36.6% | 46.8% |
| Interquartile Range (IQR) | 16.5% | 31.6% |
| Standard Deviation (Sample) | 21.9% | 18.9% |
| Standard Deviation (Population) | 21.9% | 18.7% |
Similar Demographics by Child Poverty Among Girls Under 16
Demographics Similar to Americans by Child Poverty Among Girls Under 16
In terms of child poverty among girls under 16, the demographic groups most similar to Americans are Immigrants from Cuba (18.8%, a difference of 0.14%), Nigerian (18.7%, a difference of 0.32%), Immigrants from Nicaragua (18.8%, a difference of 0.36%), Ecuadorian (18.8%, a difference of 0.43%), and Marshallese (18.7%, a difference of 0.47%).
| Demographics | Rating | Rank | Child Poverty Among Girls Under 16 |
| Fijians | 1.1 /100 | #234 | Tragic 18.6% |
| Nepalese | 1.1 /100 | #235 | Tragic 18.6% |
| Alsatians | 1.1 /100 | #236 | Tragic 18.6% |
| Immigrants | Nigeria | 1.0 /100 | #237 | Tragic 18.6% |
| Immigrants | Eritrea | 1.0 /100 | #238 | Tragic 18.7% |
| Marshallese | 0.9 /100 | #239 | Tragic 18.7% |
| Nigerians | 0.9 /100 | #240 | Tragic 18.7% |
| Americans | 0.8 /100 | #241 | Tragic 18.8% |
| Immigrants | Cuba | 0.7 /100 | #242 | Tragic 18.8% |
| Immigrants | Nicaragua | 0.7 /100 | #243 | Tragic 18.8% |
| Ecuadorians | 0.7 /100 | #244 | Tragic 18.8% |
| Shoshone | 0.6 /100 | #245 | Tragic 18.9% |
| Immigrants | Laos | 0.6 /100 | #246 | Tragic 18.9% |
| Immigrants | Ghana | 0.5 /100 | #247 | Tragic 18.9% |
| French American Indians | 0.3 /100 | #248 | Tragic 19.2% |
Demographics Similar to Inupiat by Child Poverty Among Girls Under 16
In terms of child poverty among girls under 16, the demographic groups most similar to Inupiat are Immigrants from West Indies (20.7%, a difference of 0.070%), Immigrants from Caribbean (20.7%, a difference of 0.34%), Immigrants from Senegal (20.7%, a difference of 0.38%), Immigrants from Grenada (20.7%, a difference of 0.49%), and Mexican (20.9%, a difference of 0.52%).
| Demographics | Rating | Rank | Child Poverty Among Girls Under 16 |
| Immigrants | Haiti | 0.0 /100 | #290 | Tragic 20.6% |
| Chippewa | 0.0 /100 | #291 | Tragic 20.6% |
| Immigrants | Latin America | 0.0 /100 | #292 | Tragic 20.6% |
| Immigrants | Grenada | 0.0 /100 | #293 | Tragic 20.7% |
| Immigrants | Senegal | 0.0 /100 | #294 | Tragic 20.7% |
| Immigrants | Caribbean | 0.0 /100 | #295 | Tragic 20.7% |
| Immigrants | West Indies | 0.0 /100 | #296 | Tragic 20.7% |
| Inupiat | 0.0 /100 | #297 | Tragic 20.8% |
| Mexicans | 0.0 /100 | #298 | Tragic 20.9% |
| Hispanics or Latinos | 0.0 /100 | #299 | Tragic 21.0% |
| Somalis | 0.0 /100 | #300 | Tragic 21.0% |
| Choctaw | 0.0 /100 | #301 | Tragic 21.1% |
| Seminole | 0.0 /100 | #302 | Tragic 21.2% |
| British West Indians | 0.0 /100 | #303 | Tragic 21.3% |
| Indonesians | 0.0 /100 | #304 | Tragic 21.3% |