Alsatian vs Immigrants from Norway Nursery School
COMPARE
Alsatian
Immigrants from Norway
Nursery School
Nursery School Comparison
Alsatians
Immigrants from Norway
98.1%
NURSERY SCHOOL
80.3/ 100
METRIC RATING
144th/ 347
METRIC RANK
98.2%
NURSERY SCHOOL
96.6/ 100
METRIC RATING
112th/ 347
METRIC RANK
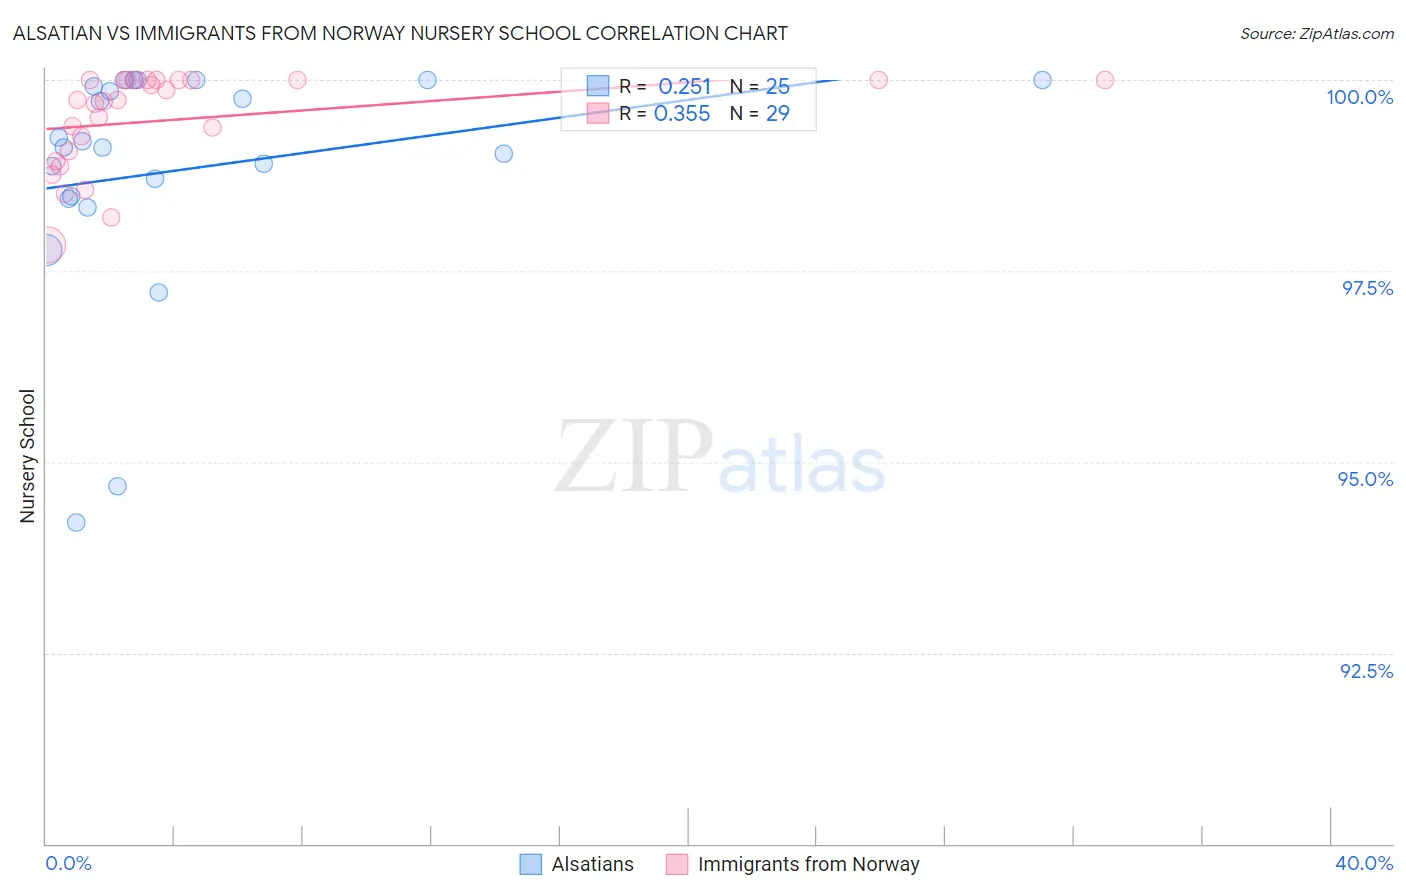
Alsatian vs Immigrants from Norway Nursery School Correlation Chart
The statistical analysis conducted on geographies consisting of 82,682,365 people shows a weak positive correlation between the proportion of Alsatians and percentage of population with at least nursery school education in the United States with a correlation coefficient (R) of 0.251 and weighted average of 98.1%. Similarly, the statistical analysis conducted on geographies consisting of 116,716,420 people shows a mild positive correlation between the proportion of Immigrants from Norway and percentage of population with at least nursery school education in the United States with a correlation coefficient (R) of 0.355 and weighted average of 98.2%, a difference of 0.15%.
Nursery School Correlation Summary
| Measurement | Alsatian | Immigrants from Norway |
| Minimum | 94.2% | 97.8% |
| Maximum | 100.0% | 100.0% |
| Range | 5.8% | 2.2% |
| Mean | 98.8% | 99.5% |
| Median | 99.1% | 99.7% |
| Interquartile 25% (IQ1) | 98.5% | 99.0% |
| Interquartile 75% (IQ3) | 100.0% | 100.0% |
| Interquartile Range (IQR) | 1.5% | 1.00% |
| Standard Deviation (Sample) | 1.5% | 0.63% |
| Standard Deviation (Population) | 1.5% | 0.62% |
Similar Demographics by Nursery School
Demographics Similar to Alsatians by Nursery School
In terms of nursery school, the demographic groups most similar to Alsatians are Marshallese (98.1%, a difference of 0.0%), Immigrants from Turkey (98.1%, a difference of 0.010%), Burmese (98.1%, a difference of 0.010%), Immigrants from Israel (98.1%, a difference of 0.010%), and Filipino (98.1%, a difference of 0.010%).
| Demographics | Rating | Rank | Nursery School |
| Israelis | 88.2 /100 | #137 | Excellent 98.1% |
| Immigrants | Romania | 88.0 /100 | #138 | Excellent 98.1% |
| Blackfeet | 87.5 /100 | #139 | Excellent 98.1% |
| Palestinians | 83.7 /100 | #140 | Excellent 98.1% |
| Immigrants | Turkey | 83.0 /100 | #141 | Excellent 98.1% |
| Burmese | 81.7 /100 | #142 | Excellent 98.1% |
| Marshallese | 81.2 /100 | #143 | Excellent 98.1% |
| Alsatians | 80.3 /100 | #144 | Excellent 98.1% |
| Immigrants | Israel | 78.5 /100 | #145 | Good 98.1% |
| Filipinos | 78.5 /100 | #146 | Good 98.1% |
| Hmong | 75.7 /100 | #147 | Good 98.1% |
| Immigrants | Greece | 75.4 /100 | #148 | Good 98.1% |
| Apache | 73.2 /100 | #149 | Good 98.1% |
| Jordanians | 72.9 /100 | #150 | Good 98.1% |
| Soviet Union | 71.6 /100 | #151 | Good 98.0% |
Demographics Similar to Immigrants from Norway by Nursery School
In terms of nursery school, the demographic groups most similar to Immigrants from Norway are Immigrants from Latvia (98.2%, a difference of 0.0%), Pima (98.2%, a difference of 0.010%), German Russian (98.2%, a difference of 0.010%), Immigrants from Singapore (98.2%, a difference of 0.010%), and Immigrants from Czechoslovakia (98.2%, a difference of 0.010%).
| Demographics | Rating | Rank | Nursery School |
| Turks | 97.4 /100 | #105 | Exceptional 98.2% |
| Immigrants | Switzerland | 97.3 /100 | #106 | Exceptional 98.2% |
| Basques | 97.3 /100 | #107 | Exceptional 98.2% |
| Pima | 97.1 /100 | #108 | Exceptional 98.2% |
| German Russians | 97.1 /100 | #109 | Exceptional 98.2% |
| Immigrants | Singapore | 96.9 /100 | #110 | Exceptional 98.2% |
| Immigrants | Czechoslovakia | 96.8 /100 | #111 | Exceptional 98.2% |
| Immigrants | Norway | 96.6 /100 | #112 | Exceptional 98.2% |
| Immigrants | Latvia | 96.4 /100 | #113 | Exceptional 98.2% |
| Ute | 96.4 /100 | #114 | Exceptional 98.2% |
| Iranians | 96.3 /100 | #115 | Exceptional 98.2% |
| Spanish | 95.8 /100 | #116 | Exceptional 98.2% |
| Immigrants | France | 95.6 /100 | #117 | Exceptional 98.2% |
| Yugoslavians | 95.4 /100 | #118 | Exceptional 98.2% |
| Thais | 95.0 /100 | #119 | Exceptional 98.2% |